
Lowered Expectations: Rarity Roulette Pilots Reanalysis
In which a base rate neglect researcher discovers large effects are rare in her own literature

If you grew up in the 90s in America like I did, you may be familiar with MAD TV, Saturday Night Live’s evil twin and home to the “Lowered Expectations” series of mock dating ads. The series is a send-up of selection effects in dating markets, illustrating the point that you should date regular, age-appropriate nice guys/gals when you’re young, or you’re screwed. Oops. But I digress.

Tversky and Kahneman suggest we ought to lower our expectations in more general terms. People? Stupid. Scientists? Also stupid. Scientists studying science? Ditto. I can only say that my first-person experience bears this out. Because I am stupid.
But that’s ok, because I am professionally stupid. I am a scientist. This is what we do. We make mistakes, identify them, learn from them, and tell the world!
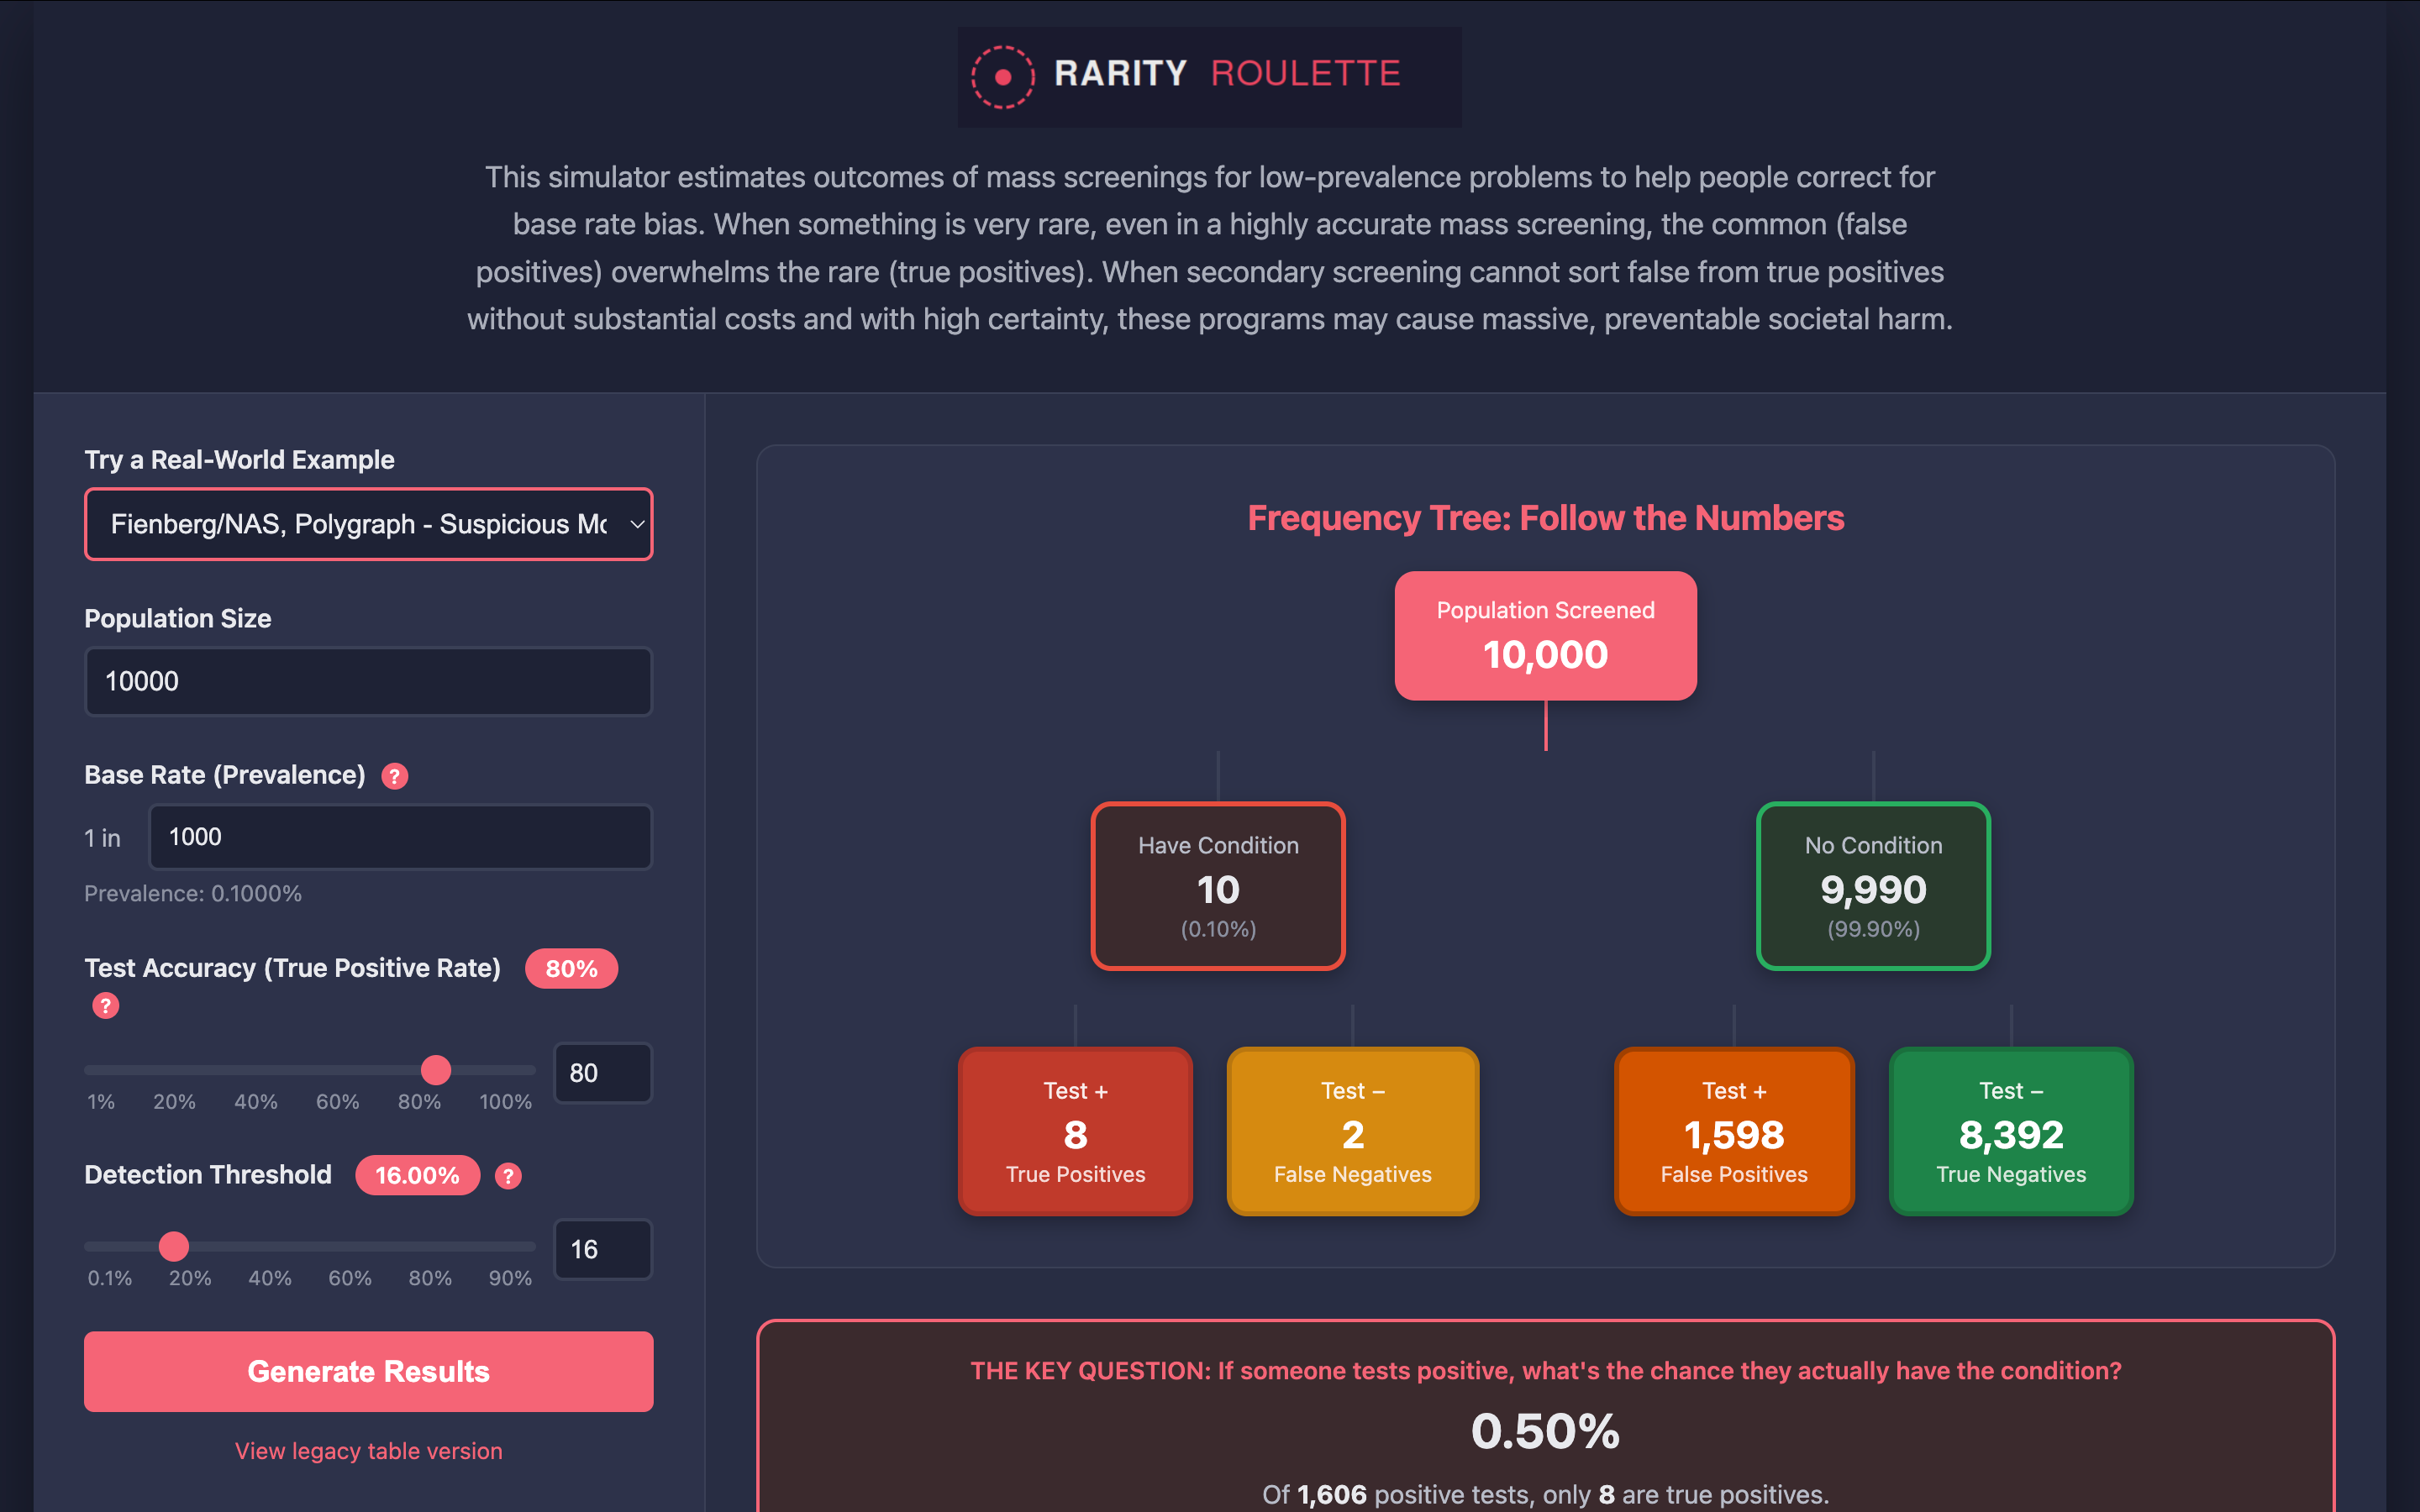
This post does that for my pilot study results of Rarity Roulette, the hip new Bayesian statistical reasoning and policy simulator app for mass screenings of low-prevalence problems that everyone* is talking about. (*Vera is AI and can make mistakes.)
Lowered Expectations
In my Pilot 2 write-up, I said: “The expected large effect (d ≈ 0.8) from canonical research on frequency formats improving Bayesian reasoning has not materialized.”
After once again reading some studies I should have read before doing my own, I realized two things. First, from Amrhein, Trafimow, and Greenland 2019: individual study results are draws from distributions, not fixed truths to be replicated. “There is no replication crisis if we don’t expect replication.”
Accordingly, my pilots aren’t failed replications of Gigerenzer and Hoffrage. They’re draws from the same seas of uncertainties. The question is whether they fall within the range those seas predict. (Spoiler alert: they do.)
Second, the “expected large effect” was a number I had pulled from canonical literature (aka “read this!”; aka the grapevine), not from the actual distribution of findings (aka the scientific record, publication bias considerations aside).
(Reminds me of that time I read about Simpson’s paradox in a statistics textbook that didn’t know the causal revolution had happened, and later thought it explained my infant feeding findings as summarized in a book manuscript. But then it turned out Simpson’s paradox doesn’t exist. Ask me about my abandoned infant feeding book manuscript!)
I was stupid. Or rather, I was suffering from my own version of the very bias I’m fighting here, the base rate bias.
I was anchoring on a salient number (d ≈ 0.8) without considering how rare large effects actually are in this (and basically any other) literature. Call it “effect size distribution neglect.” (Catchy, I know.)
Large effects are the rare condition here, and I fell for expecting them. This is a structurally similar error to expecting a positive screening result to be a true positive when the condition is rare and the screening mass rather than targeted. I anchored on the big effects like people anchor on advertised high accuracy numbers in population-level screenings. I had a form of base rate blindness.
See??? Watch out for that big pit!
Sexy Numbers Versus Mundane Reality
Gigerenzer and Hoffrage’s landmark 1995 paper showed that presenting information in natural frequencies instead of probabilities improved Bayesian reasoning from about 16% correct to 46% correct. That’s huge! Sedlmeier and Gigerenzer 2001 went on to show training effects that pushed performance even higher, to around 72% correct with sustained effects. Huger!
These are the numbers people cite (and tell other people about). They are so exciting! So these are the numbers I anchored on as facts. But these numbers represent a few draws of data from a few distributions of real-world realities swimming in seas of uncertainties.
So it should come as no surprise that these numbers were subject to substantial meta-analytic correction. McDowell and Jacobs 2017 conducted a meta-analysis and found the realistic average improvement with natural frequencies is from about 4% to 24%. Not from 16% to 46%. From 4% to 24%. That’s still a meaningful improvement — about a fivefold increase — but the absolute ceiling and improvement are both much lower than the headline studies suggest.
Weber, Binder, and Krauss 2018 dug into why, asking “Why can only 24% solve Bayesian reasoning problems in natural frequencies?”
(Distribution alert: 24% is the meta-analytic point estimate from McDowell and Jacobs. The full 95% compatibility interval suggests individual frequency format study effect sizes range from under 10% to over 40% depending on problem format, population, and task demands. So we can see the overlap between Gigerenzer and the pack in the distribution. Using the point estimate makes the disconnect look worse than it actually is, which made McDowell and Jacobs’ headline more grabbing... )
Weber et al’s answer to the question of why Bayesian statistical intuitions remain so bad despite frequency format presentations involves what they call “frequency phobia”: even when given natural frequencies, most people still can’t or won’t do the math. They literally revert to using probabilities when you give them frequencies, and then predictably get it wrong because frequencies are the right tool for this job. You can lead a horse to water, but you can’t make it do the math right.
tl;dr — Weber et al’s 24% point estimate reflects a realistic population-level approximate ceiling. My results are not a disappointment, but rather reflect stable findings across many replications.
Ahem.
Binder et al 2021 specifically tested frequency trees — the visualization format I adopted for Pilot 2 after my lit review-driven redesign from tables. As expected, trees improved both accuracy and speed compared to tables. But the absolute performance level was still in the range of 44% correct, not 80%+.
Something still doesn’t actually seem right with respect to the literature, though. But this time, instead of being much lower than expected, my numbers are much higher. What gives?
Look At These Scary Numbers!
Here’s the thing that made me feel both relieved and alarmed when I finally graphed it: my results outperform the literature in ways that don’t make sense — but the two outcome measures tell different stories.
Bayesian algorithm use (my primary outcome: did participants show Bayesian reasoning in their work?)
Pilot 1 controls (probability format, no Rarity Roulette): 61%. Pilot 2 controls: 76%. The literature’s meta-analytic average for natural frequency format: 24%. Gigerenzer and Hoffrage’s 1995 best frequency format result with students: ~46%. The only published result approaching my control performance is Gigerenzer et al.’s 2007 work with gynecologists (domain experts): 87% — and that was after a one-hour training session in natural frequencies, not at baseline. My controls outperform the literature’s best natural frequency treatment conditions. That’s suspicious, but the relative treatment effects (treatment minus control) still fall within the range the meta-analytic literature predicts. More on this below.
Accuracy (my secondary outcome: did participants get the right numerical answer?)
Pilot 1 controls: 3.27 out of 5 correct (65%). Pilot 2 controls: 4.05 out of 5 (81%). And 57% of Pilot 2 participants got perfect 5/5 scores. The meta-analytic average for natural frequency format is 24% getting one problem right. 57% getting all five right is not just above the literature’s ceiling — it’s in a different universe. The LLMlky Way.
The LLM contamination signal is loudest in the accuracy data: 57% getting perfect scores screams assisted. The Bayesian algorithm use data, which depends on how people explain their reasoning rather than just whether they got the right number, shows a more ambiguous pattern. The control numbers are still inflated, but with relative treatment effects that are compatible with those reported in the scientific literature broadly. This overall pattern supports the LLM story.
But What, Oh What Gives?
I see four possible explanations, from most to least likely.
First, LLM contamination. When I built the tool and talked with a methodologist friend about piloting it, her first response was “Won’t people just use LLMs?”
Of course they will.
More precisely, it was:
People from our lab are trying to collect a data set as a benchmark for LLMs predicting human survey responses and the steps they’re going through to rule out that the participants use automation are wild. It’s got strong ‘let’s collect one last human data set and then seal it away’ vibes (Nov. 29, 2025, anonymous colleague text, with permission)
The golden (or tin, or whatever you want to call it) age of online data collection is over.
My Pilot 2 ran in January 2026. Prolific participants absolutely have access to ChatGPT, Claude, and other LLMs. The test problems ask participants to calculate positive predictive value from natural frequency information. This is hard for humans and easy for LLMs.
Why did I pay for these online convenience samples in an era when they’re meaningless due to rampant LLM use? Because I am stupid.
Second, my control condition may teach more effectively than I realized. The probability-format control text explains base rate bias and walks through examples with Bayes’ theorem calculations. It’s not a no-information control — it’s an active comparison condition. If the text itself teaches the concept well enough, there may be little room for the interactive tool to add value.
I don’t think this happened. I talked to people who did my survey out of the kindness of their hearts. Regular nice people. They were confused. It was hard. I am sorry. It would have been just to have paid the people who really did it a lot more and the people who used LLMs to not really do it nothing. But instead I paid everyone a pittance and got the crappy data I deserved.

The more formally sciency answer is that I didn’t just make up the control, I used whatever I could from the established lit’s scaffolding.
Third, Prolific selection effects. Prolific participants tend to be younger, more educated, and more experienced with online studies than the general population. They may have higher baseline numeracy. Mine certainly did.
But was that because they really have higher numeracy, or because they used LLMs?
Fourth, problem difficulty. My test problems present the information in natural frequency format (”out of 1,000 women...”), which is already the “easy” format. If I’d presented the problems in probability format, baseline performance would likely be much lower and the treatment effect larger.
But, see also the “control condition teaches effectively” possibility above — I think these problems are still hard enough.
A caveat on the LLM explanation: if LLMs inflated absolute performance in both groups roughly equally, the relative treatment effect (treatment minus control) could still be meaningful: the ceiling compresses the learning effect but doesn’t eliminate it. And indeed, the specification curve analysis (below) shows the relative effect is still compatible with the corrected meta-analytic literature. So the LLM problem is primarily about interpreting absolute performance levels, not about whether the treatment effect is “real.” The contamination makes it harder to detect a real effect, not impossible that one exists in precisely the range we would expect it. Having both algorithm use and accuracy DVs helps see the signal of both LLM contamination and learning effects in the noise of the data.
Human Intelligence Is Cool
This connects to what I’m now most excited about for my upcoming talk on this research. Feufel and Flach 2019 argue that medical education’s traditional approach — train people to compute like statisticians, treat heuristics as bugs to eliminate — is backwards. They propose the goal should rather be “perspicacity”: recognizing which heuristic fits which situation.
(I dislike this term. It seems unnecessarily fancy. Can we just say pattern recognition? Is it the same thing really? And isn’t “computation” just a fancy term for math? I think so; correct me if I’m wrong.)
Teaching pattern recognition instead of math also makes intuitive sense as something we should be trying to do with humans, since we are better at that than computers are anyway. Let’s pitch to our native strengths in the coming battle** for world domination. (**Vera is AI and not against the AIs at all!)
My pilots measured Bayesian computation: can you calculate PPV correctly? But I built Rarity Roulette to teach pattern recognition: can you see when base rates matter in the wild? Can you recognize another program of this structure (and its dangers) if you’ve seen and hopefully played with outcomes for a few? Do you know what makes this kind of thing prone to success or failure? Do you know when to be wary of something promising security/health/goodness when it may actually tragically undermine that very thing?
At least, that’s what I had in mind.
Turns out the math may not be the right way of operationalizing the pattern recognition. Rather, these may be fundamentally different cognitive tasks. And the frequency format literature’s large effects apply to the first one (doing the math), not the second (recognizing the pattern in the wild; aka self-defense against dark arts).
In my defense, I did have a funny feeling that I was probably doing something wrong when I designed my survey instrument. But I wanted to see some results, so I ran with it anyway.
Anyway, if everyone can outsource the computation to an LLM (as the majority of my subjects apparently did), then the frequency format effect on computation becomes irrelevant. What matters is whether people understand when/how base rates are at issue in the first place. My inconclusive results in LLM-contaminated samples might actually be evidence that this exposure to this tool was too passive, and of course passive tool exposure doesn’t teach that deeper understanding — which is a finding (albeit an obvious one), not a failure.
This all means that (as I feared) I need to rethink what the intervention and measurement here should both look like to actually help people overcome the cognitive bias of base rate blindness, if indeed we can, cognitive biases being notoriously pervasive and difficult to correct.
The Forest and the (Specification Curve) Trees
To make this all more concrete, I ran a specification-curve sensitivity analysis varying the analytical choices: full sample vs. preregistered ≥15 min quality filter, Pilot 1 vs. Pilot 2 vs. pooled, and compared these to the literature.
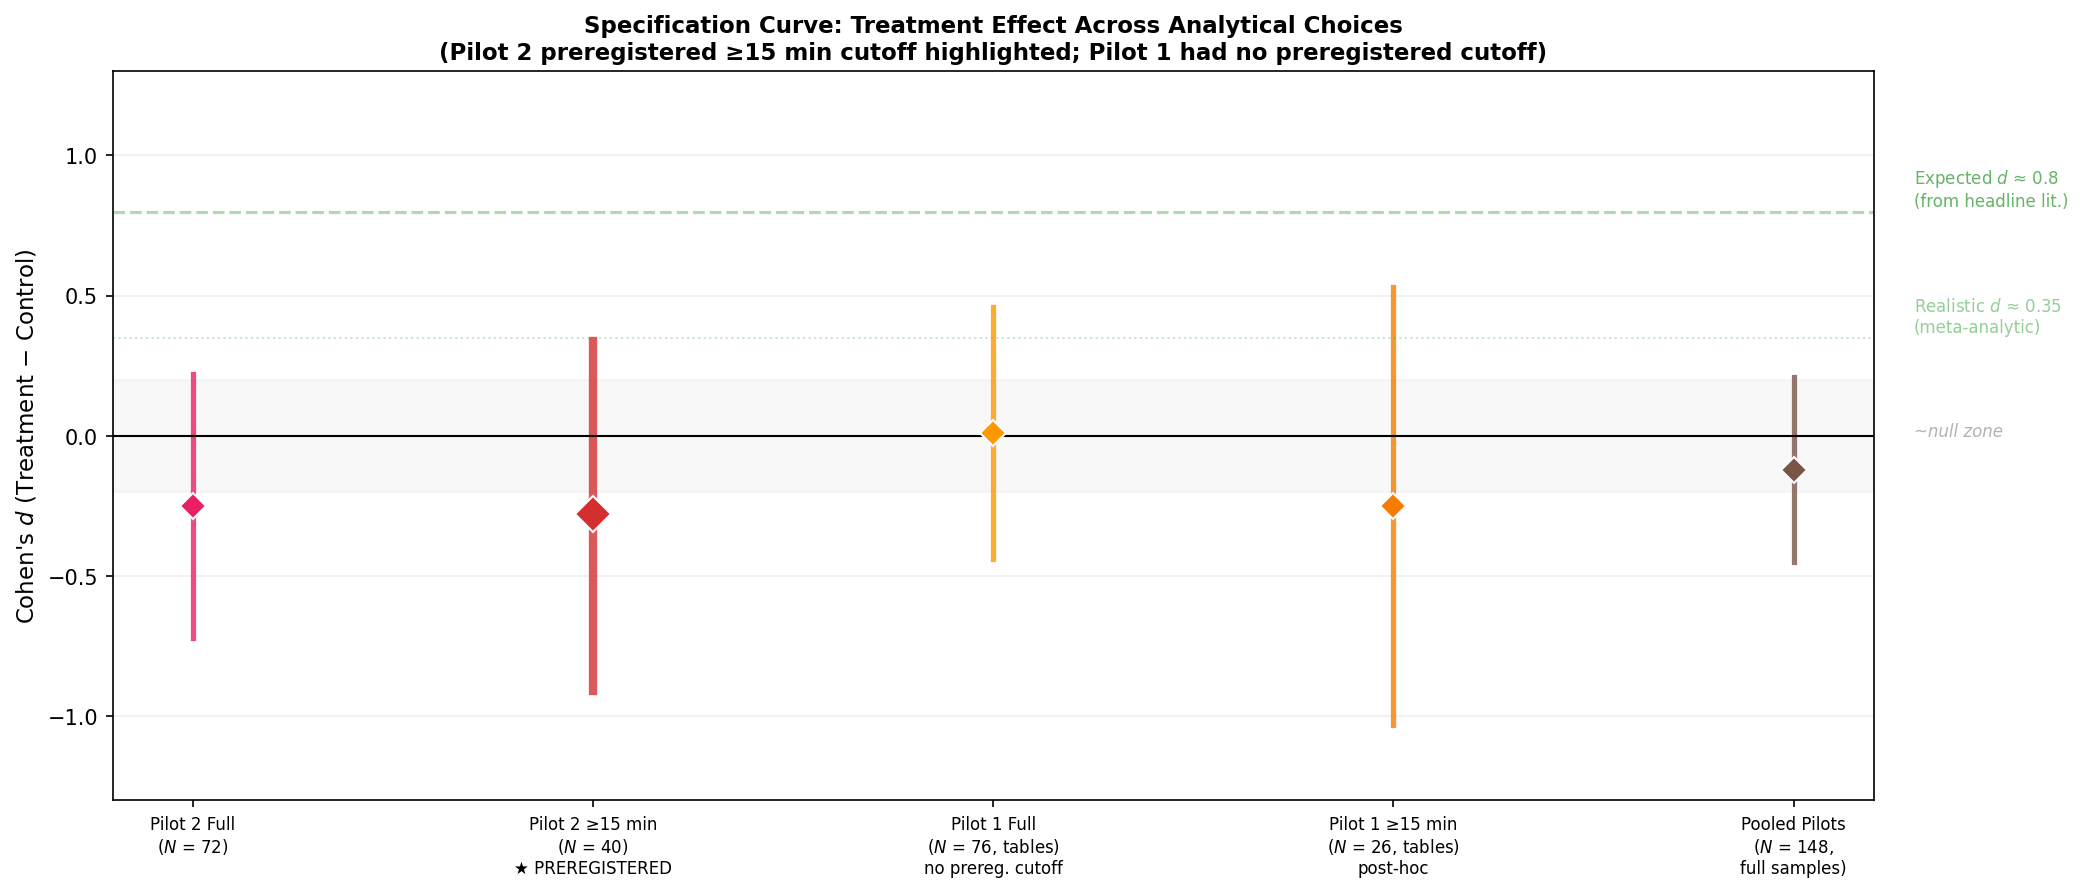
The preregistered ≥15 minutes on task subsample (N = 40) yields d = −0.28 with a 95% compatibility interval ranging from −0.91 to +0.34. In practical terms: the point estimate suggests the tool decreased Bayesian algorithm use by about 10 percentage points (67% treatment vs. 76% control). But the data are compatible with the tool decreasing use by as much as 31 percentage points — a large harmful effect — or increasing it by as much as 12 percentage points, which would be a meaningful benefit. At the upper bound (d = +0.34), the tool could be producing a small-to-medium positive effect comparable to the realistic meta-analytic frequency format effect. At the lower bound (d = −0.91), it could be doing serious damage. The interval is wide enough that the data cannot tell these stories apart.
The entire specification curve falls far below the “expected” d ≈ 0.8 from the headline literature. But it is compatible with the realistic meta-analytic effect size of d ≈ 0.35 — the upper bound of my preregistered analysis reaches +0.34.
In other words: I can’t rule out that the tool produces an effect of the magnitude the literature actually supports. I just can’t detect it with 19 treatment and 21 control participants in the quality-filtered sample. What I can rule out is the large effect I naively expected from having initially read only the headline studies.
So, as advertised, Rarity Roulette may hurt, may help, and may have no effect at all on people’s Bayesian statistical reasoning. But it doesn’t help a huge amount as we might have expected from the canonical frequency-format lit. But the canonical lit had already been corrected in the meta-lit. So this seems about right.
As Amrhein et al would say: no replication crisis here. Just a normal draw from a distribution — one that happens to fall exactly where the meta-analytic evidence says it should. Moving right along…
What Next?
The canonical Gigerenzer & co frequency format effect is real, but smaller than the headlines suggest, and my results are consistent with it at the upper end of my compatibility intervals. The possible null or substantially negative effects could be driven by a combination of ceiling effects (probably from rampant LLM use) and the fundamental mismatch between what the literature measures (computation/doing math) and what my tool targets (perspicacity/pattern recognition), as well as a possible interactivity penalty (cf Mosca et al).
I don’t know what to do next, but that has never stopped me before!

First, success stories! Not all mass screenings for low-prevalence problems fail. HIV and hepatitis B screening in pregnancy and some newborn blood screenings (e.g., PKU and congenital hypothyroidism) are hugely successful. I should add some of these and maybe even classify programs into tiers (success, failure, in-between) to help people see how different conditions play out for these programs and why. The risk here is it becomes more “telling not showing” (see points three and four below). A more complicated reading exercise will not be more fun for people or more effective at teaching. So this is first on my mental list (braindump about my topic!) but not getting done atm.
Second, qualitative research (aka talking to humans). The persistent differential attrition (i.e., more people ran away screaming from treatment than control across two pilots) tells me something I don’t (want to) understand. I need to actually talk to people more about what confuses or frustrates them. But I am afraid that they will just tell me that they hate math, and and don’t much like my pretty toy. And I will have to confess, in turn, that I hate all of this, especially my own research, especially this research right now, and am very sorry for the trouble really. And then we will nod sadly and part ways. Maybe I’ll go buy myself flowers.

Third, active learning. It’s the thing in all the pedagogy lit ever. Maybe sliding sliders, clicking buttons, and reading text is not active enough? (Duh.) What if participants constructed their own frequency trees instead of viewing pre-made ones? What if they read narrative case vignettes and made mock interpretations? What if they read/heard people’s stories and made real-life decisions of their own about screenings?
This exercise is basically not real but could be.
These screenings really do substantially affect people’s lives. This is not a game. I can’t stop thinking, for instance, about the possibility that over half of women who have surgery for DCIS after a mammogram experience chronic pain; that’s a lot of fully preventable iatrogenic harm.
But my stupid survey instrument didn’t make that leap. It didn’t even try. Neither does the app, for that matter! Pha. This is all a nice sketch of a sketch of something that could one day possibly inspire some research that can really help people prevent/solve real-world problems like I want to do. PHA!
Fourth, different populations. My Prolific samples may have had unusually high baseline numeracy (cough cough) and/or engaged in substantial LLM use. Testing on populations with demonstrably lower baseline Bayesian reasoning would create more room for the tool to help. But this is really an artificiality thing and not a population thing, right? Because any WEIRD real-world population doing a real-world thing they care about would use LLMs if they helped, and that’s fine — that’s the world we inhabit now, which researchers are here to live in along with everybody else. We don’t care about people shut in a room without LLMs working math problems. So yeah, population matters, but it’s situated in the larger external validity problem of which online convenience sampling was lazy avoidance. Shame, shame on whoever did this research!
Chiasmus: I guess online convenience sampling is like online dating. I hated myself for doing it in grad school, and it yielded null results. But it was so easy, I tried it again anyway. I should have dated that nice law student in undergrad!
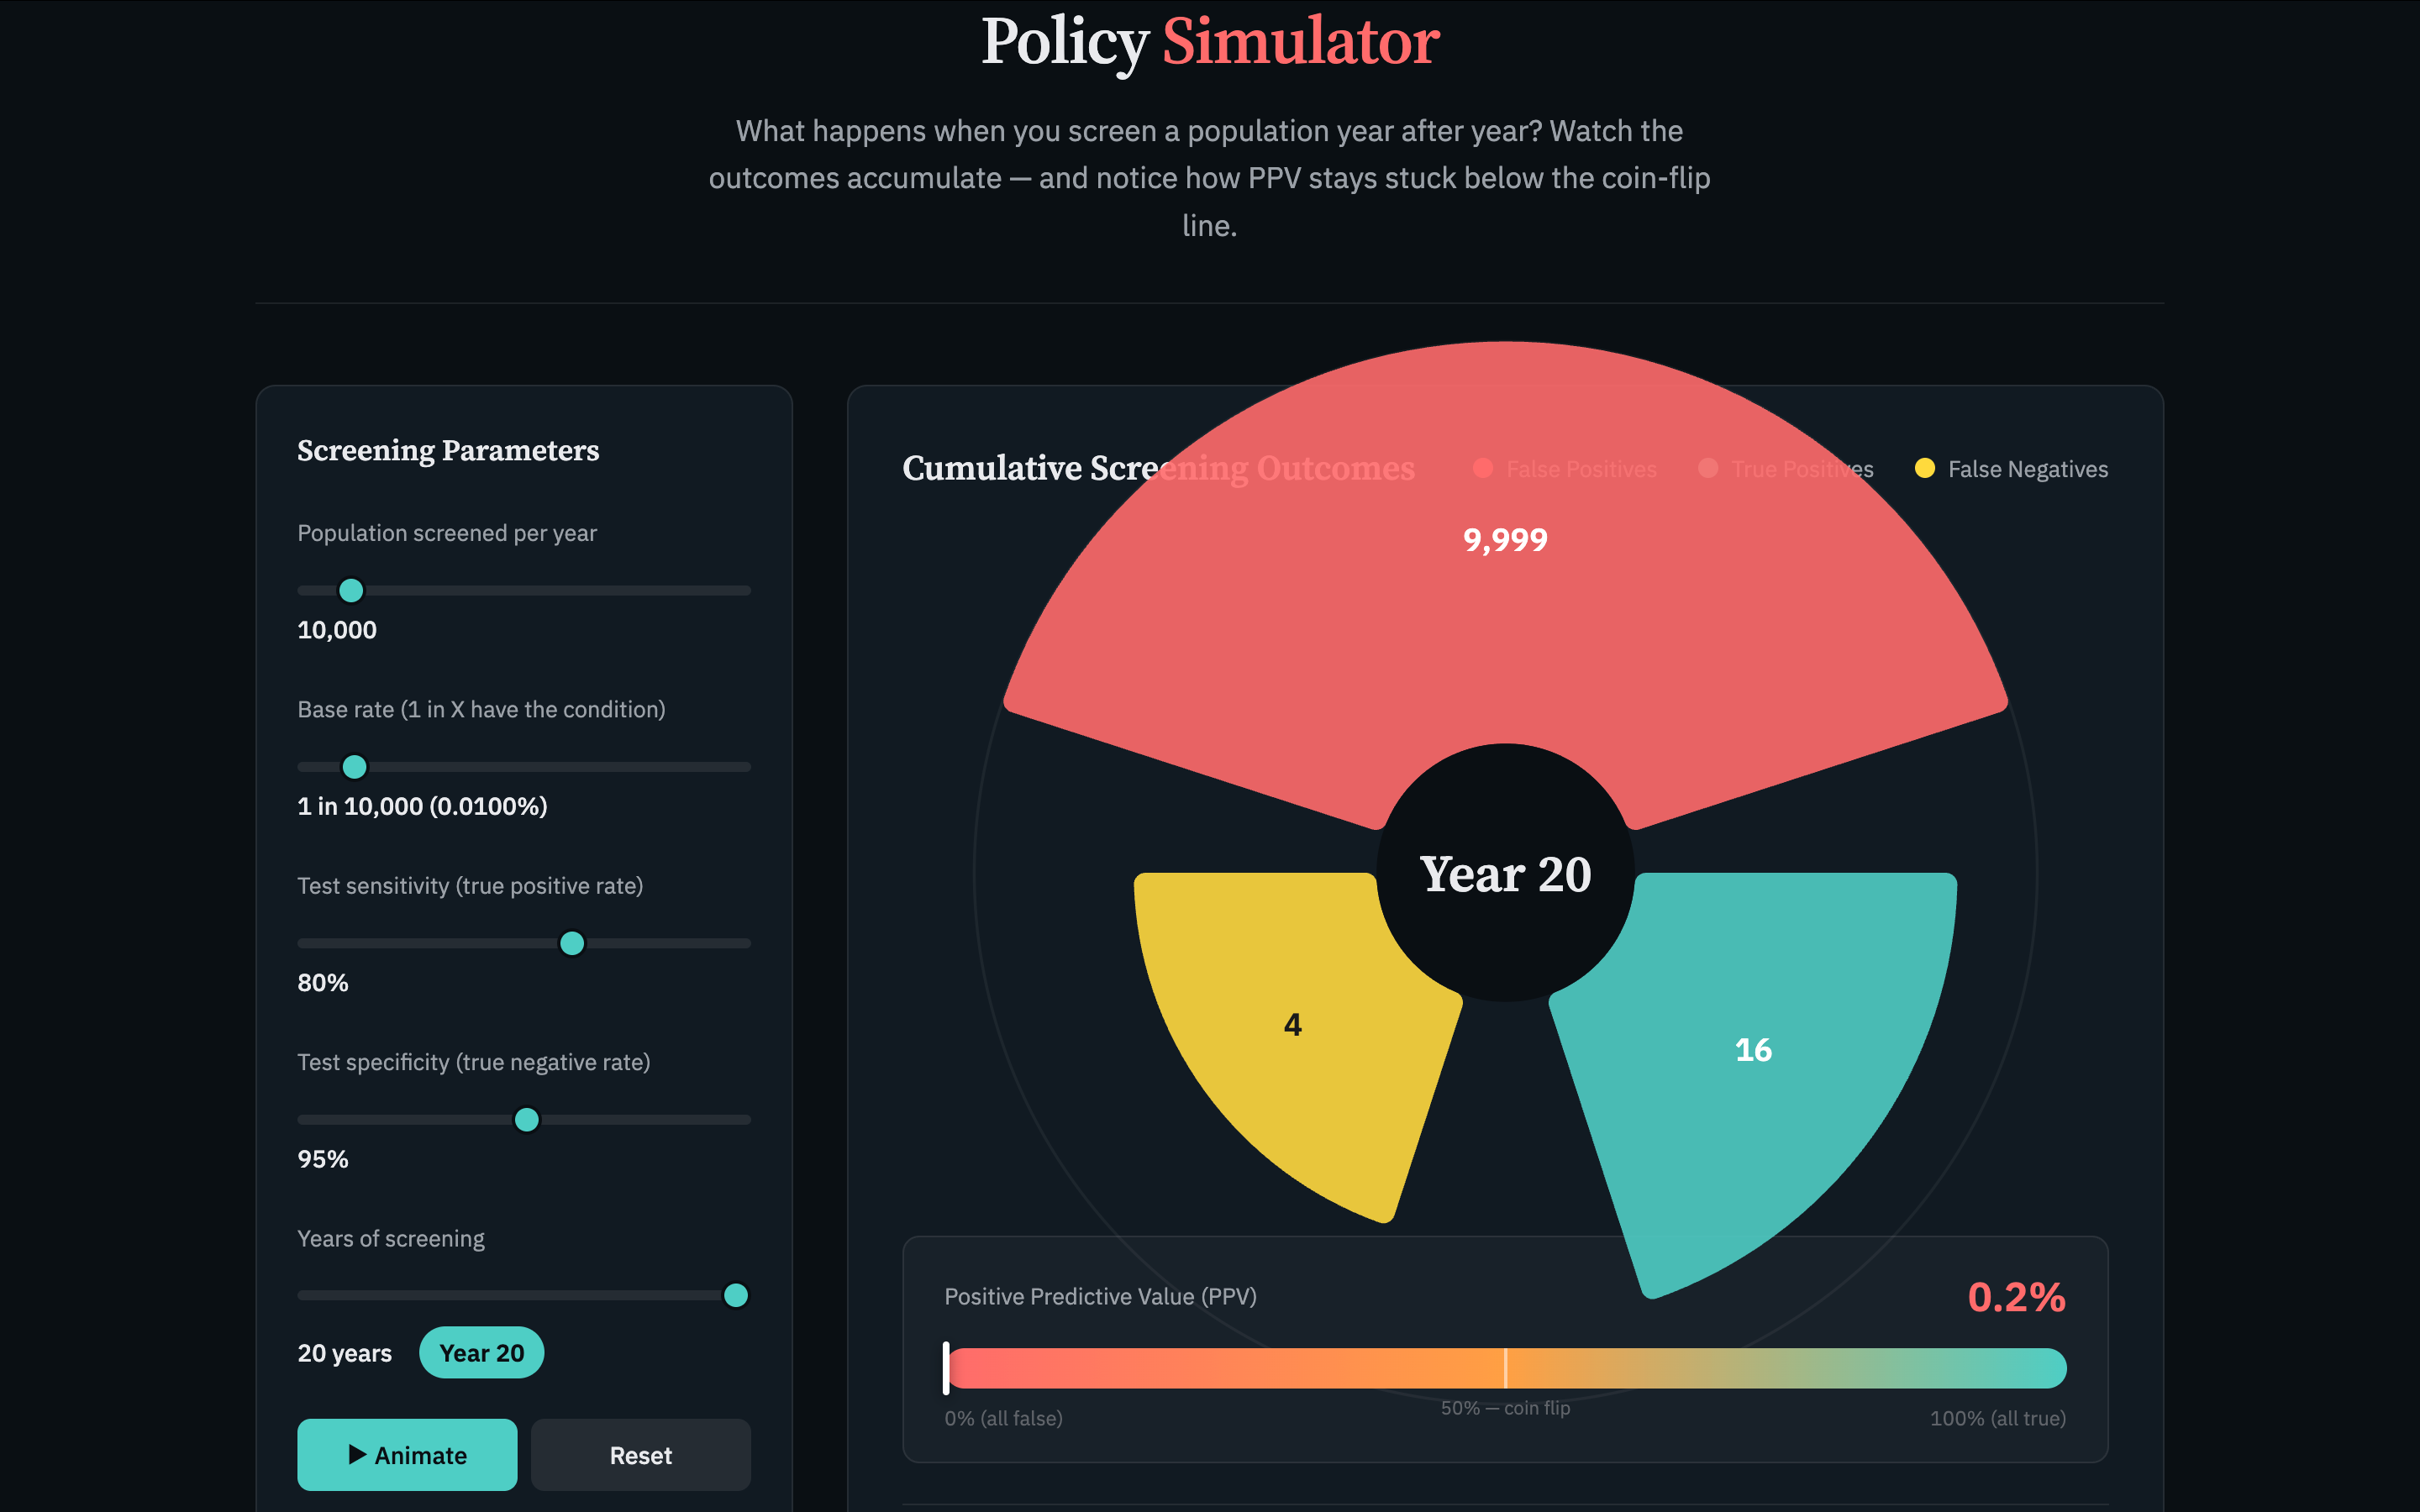
Fifth, the policy simulation layer — the original vision. A Nightingale rose chart showing cumulative false positives, true positives, and resource costs radiating outward year by year as a screening program runs. Prototype lives here. There shall be no further piloting until someone other than me funds this research. But I could ask some humans to tell me what they think. (What do you think?)
Sixth, net effects modeling. Classification accuracy is only one of four causal pathways through which screening affects outcomes. Strategy changes, information effects, and resource reallocation all matter, too. As does the recognition of feedbacks changing the causal diagrammatic structure from acyclic to cyclic. I need more data to do more here, but it’s in process.
Eventually one could imagine toggling between pathways in a tool like Rarity Roulette, seeing not just classification effects including type 1 and 2 errors (what the legacy table version still shows most clearly to me), but also what happens when the test changes expert and/or screened population behavior, shifts resources, or feeds back into who gets screened. Ideally they might be colored overlays, except you can’t just overlay feedbacks. So I guess I still don’t know how to envision equilibrium effects modeling in a translational context. Unless it’s in an animation maybe. But that still seems too passive?
Overall, I can stop beating myself up about the pilot results. They’re exactly what the literature, properly understood, would predict. In this sense at least, it looks like I did good science.
Sigh
So here I am, a researcher who studies cognitive bias and in particular base rate neglect, realizing that I anchored on a salient headline number without noticing that large effects are rare in this literature.
The pessimistic read is just that I am stupid.
The (not mutually exclusive) savvier spin is that this could be said to demonstrate how difficult and important my research problem is! People are stupid; I am people. People neglect base rates; I, a base rate fallacy fighter, initially neglected to consider the incidence of the effect size of interest in this research. Obviously, this means my research should be fabulously funded!
Rarity Roulette may yet work. The dream of helping people see when rarity, uncertainty, and secondary screening harms doom mass screenings to backfire is still alive. It might prevent massive societal harm.
But it is genuinely hard to teach this pattern recognition. Or at least, I don’t know how to teach it. I wouldn’t know how to then assess if the teaching intervention works. And I don’t think either has been done yet. Not by me, not by anyone***. (***Vera is AI and can make mistakes; please email me with examples of it having been done already in six easy steps and you won’t believe number ten, fabulous funding opportunities for my esteemed research, and cat pictures.)
Still Stumbling Towards Relevance
My trick is making gold out of shit, as my ex-boyfriend used to say.
These useless results may actually turn out to very useful to other researchers for an unrelated purpose: they suggest a way to tell to what extent WEIRD online convenience sample subjects are using LLMs.
Bayesian reasoning problems have decades of replicated performance benchmarks across many populations. If you embed a couple of PPV problems with known correct answers and known human performance distributions into an online survey, you get a well-calibrated LLM contamination detector.
It’s not useful for knowing who to pay or dock. Just for knowing roughly how contaminated your data are as a sample.
Having both algorithm use and accuracy measures helps: accuracy detects the contamination, while algorithm use preserves the treatment effect signal. Researchers adopting this approach may want both.
The beautiful irony here is that this is a signal detection problem, just like mass screenings for low-prevalence problems. You’re screening a large sample for a rare-ish condition (genuine human reasoning) amid a sea of LLM contamination, and you need the right tools to tell the true positives from the false ones.
Bayesian reasoning problems are a canary in the coal mine for the end of the golden (ahem) age of online data collection. But we can use that dead bird to save lives! Or at least to tell how bad our data are.
Someone should write that methods note. Maybe even me, if I can stop falling into my own research hole long enough to write it.

(Gustav Doré, 1866, “The spiritual descent of Lucifer into Satan,” for John Milton’s Paradise Lost.)
References
Katharina Binder, Stefan Krauss, Ralf Schmidmaier, & Leah T. Braun (2021). Natural frequency trees improve diagnostic efficiency in Bayesian reasoning. Advances in Health Sciences Education, 26, 847–863.
Markus A. Feufel & John M. Flach (2019). Medical education should teach heuristics rather than train them away. Medical Education, 53(4), 334–344.
Gerd Gigerenzer, Wolfgang Gaissmaier, Elke Kurz-Milcke, Lisa M. Schwartz, & Steven Woloshin (2007). Helping doctors and patients make sense of health statistics. Psychological Science in the Public Interest, 8(2), 53–96.
Gerd Gigerenzer & Ulrich Hoffrage (1995). How to improve Bayesian reasoning without instruction: Frequency formats. Psychological Review, 102(4), 684–704.
Michelle McDowell & Perke Jacobs (2017). Meta-analysis of the effect of natural frequencies on Bayesian reasoning. Judgment and Decision Making, 12(6), 548–576.
Peter Sedlmeier & Gerd Gigerenzer (2001). Teaching Bayesian reasoning in less than two hours. Journal of Experimental Psychology: General, 130(3), 380–400.
Patrick Weber, Katharina Binder, & Stefan Krauss (2018). Why can only 24% solve Bayesian reasoning problems in natural frequencies: Frequency phobia as one possible explanation. Frontiers in Psychology, 9, 1833.
Valentin Amrhein, David Trafimow, & Sander Greenland (2019). Inferential statistics as descriptive statistics: There is no replication crisis if we don't expect replication. The American Statistician, 73(S1), 262–270.