
The Firm's Bayes Problem
Extending my mass screenings causal framework to businesses, and looking for the data

The boy cries wolf, the villagers come running, and there is no wolf. He does it again. By the third false alarm, the village has updated: the rational response to the alarm is to ignore it. So when the wolf actually shows up, the alarm sounds — and nobody responds.
“Alert fatigue” is the corporate name for one symptom of this: run a classifier for a rare baddie at scale — fraud, anti-money-laundering (AML), the genuinely bad hire — and the flags pile up, the analyst/manager chases, the flag is innocent. Repeat, repeat, repeat — until the flags are wallpaper, and the real wolf is flagged, but saunters by unnoticed anyway.
But fatigue is a response to the problem, not the problem. The problem is upstream and quieter: when the target is rare, almost every positive is false by sheer arithmetic — and the people running these systems may not know it. They may see “95% accurate” and read a flag as probably real, when Bayes says it’s almost certainly not.
The villagers, ironically, were the better statisticians: they at least learned the alarm was usually empty. In rare-event screening, we mostly don’t. Because we don’t see the missing wolf. Most security screenings don’t get validation of their false-positive carnage; people who themselves are false-positives of medical screenings may believe their lives were saved by completely unnecessary, life-threatening, sometimes life-altering interventions. And, in the broader business world of which security and medicine are quietly a part, nobody in operations does the base-rate math.
Most firms ask two questions about a classifier like this: “Is it accurate?” And, separately: “Is it fair?”
This post argues that both questions, as usually posed, are causally incoherent — and that the same four-part lens fixes both. This is the security-and-medicine argument I keep making, pointed at the firm. The cases change; the math doesn’t.
This post is a cousin of three earlier ones: the fairness math in Bias Research Bingo (tl;dr - different statistical definitions of fairness are incompatible); the aggregation argument in Scaffolding All the Way Up, Turtles All the Way Down (tl;dr - science with causal graphs is vulnerable to aggregation errors just like science without causal graphs); and the performativity in All the World’s a Performative Prediction (tl;dr - prediction changes the world it predicts).
Fairness Was a Causal Question All Along
Here’s the thing the firm’s compliance deck won’t tell you: you cannot satisfy the competing statistical fairness criteria at once. Not because your data scientists are lazy, but because of the base rates. When prevalence differs across groups and the test is anything short of perfect, calibration, equal false-positive rates, and equal false-negative rates become mathematically incompatible; Bayes’ Rule forces the trade-off. It’s not some man-made design failure you can engineer away. I walked through the whole zoo of these results — and Brian Hedden’s lovely synthesis, including his argument that most of these criteria aren’t necessary conditions of fairness in the first place — in Bias Research Bingo (tl;dr - when you fight the mathematical law, the law wins).
This matters for firm classifiers specifically, because rare baddies implicate the unequal-base-rate regime. Fraud, money laundering, intrusion, the genuinely bad hire — these are low-prevalence problems, and prevalence rarely sits evenly across groups. (Why would it?)
So: “Is it fair?” can’t be a checkbox we tick once our dashboard shows equal flag rates. Instead, we have to ask and answer the question: Equal by which criterion? Because we’ve already had to choose by the time we start answering, and the choice packs normative as well as statistical assumptions. It also excludes other choices.
And that’s how the science on fairness quietly became a causal literature while no one in the compliance office was looking. Niki Kilbertus and colleagues’ Avoiding Discrimination Through Causal Reasoning (NeurIPS 2017) made the move: stop asking whether an observed correlation between a protected attribute and a decision is fair, and start asking which causal pathways from that attribute to the decision are legitimate and which aren’t. (This is an extension of recognizing that story drives statistics and Simpson’s paradox doesn’t exist.) Drago Plečko and Elias Bareinboim’s Causal Fairness Analysis (2022) builds that into a full toolkit.
The upshot for managers: “fair” is not a property of an output we can audit at the end. It’s a property of a mechanism. And we can’t see mechanisms in a confusion matrix.
(My previous post “This Way Off the Bias Bandwagon” looks at a polygraph instance of this: subgroup variation in ambiguity producing exactly the fairness-criteria collision.)
The Bayesian Backfire As A Screening Problem
Before we even get to fairness, the accuracy number is lying to us, and it’s lying in the most boring possible way: base rates.
Picture an AML filter on a payments stream. Suppose, generously, it’s 95% sensitive and 95% specific — the sort of high accuracy numbers a vendor would put on a billboard. Suppose 1 in 5,000 transactions is genuinely suspicious. Run a million transactions through it:
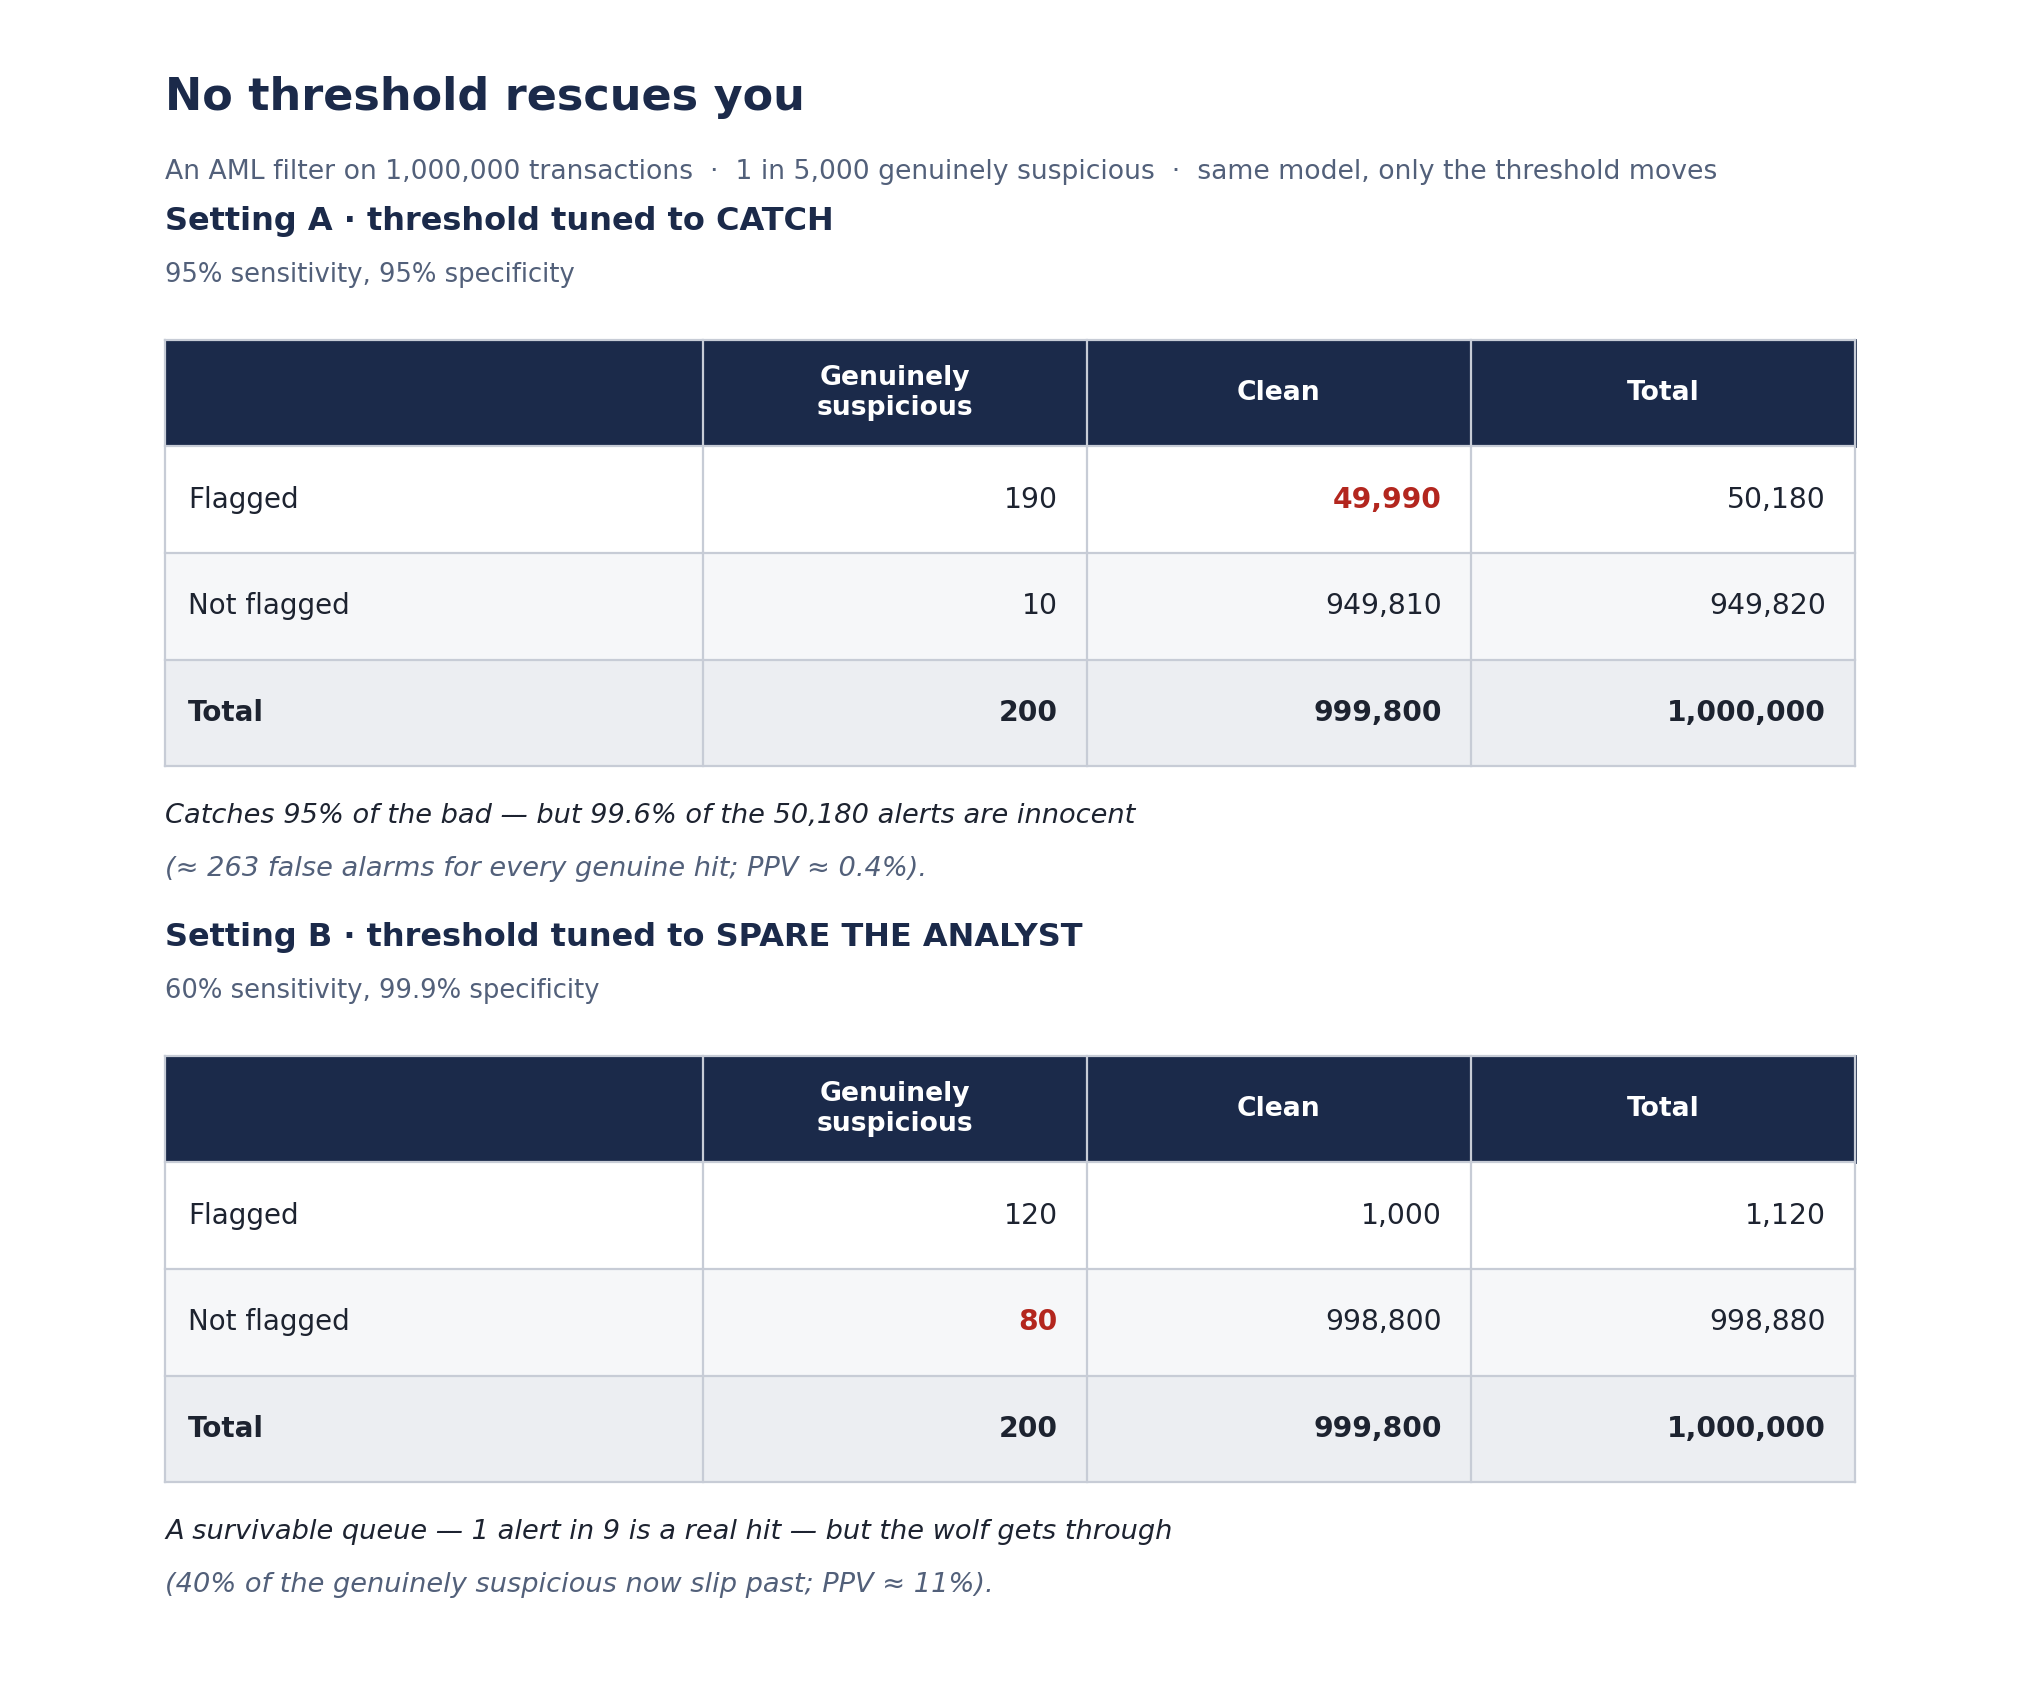
Holy false positives, Batman! Our “95% accurate” model just generated 50,180 alerts, of which 99.6% are innocent — roughly 263 false alarms for every genuine hit. The positive predictive value is about 0.4%. Which is to say, a coin would be embarrassed.
(Anyone who’s watched a real AML or SOC queue knows this isn’t a strawman. The Bank Policy Institute found that in 2017 a sample of large banks reviewed roughly 16 million alerts to file 640,000 SARs — and law enforcement followed up on a median of just 4% of those reports, implying 90–95% of the people banks flagged were likely innocent. The EU picture is no prettier: the CEPS–ECRI task force finds only about 10% of suspicious-activity reports are ever investigated, and just 1.1% of laundered money is recovered. Alert false-positive rates north of 90% are a well-documented industry open secret.)
Don’t take my word for the arithmetic. Run it yourself in Rarity Roulette: choose the newly added “Bank Policy Institute, AML Transaction Monitoring” preset from the scenario menu.
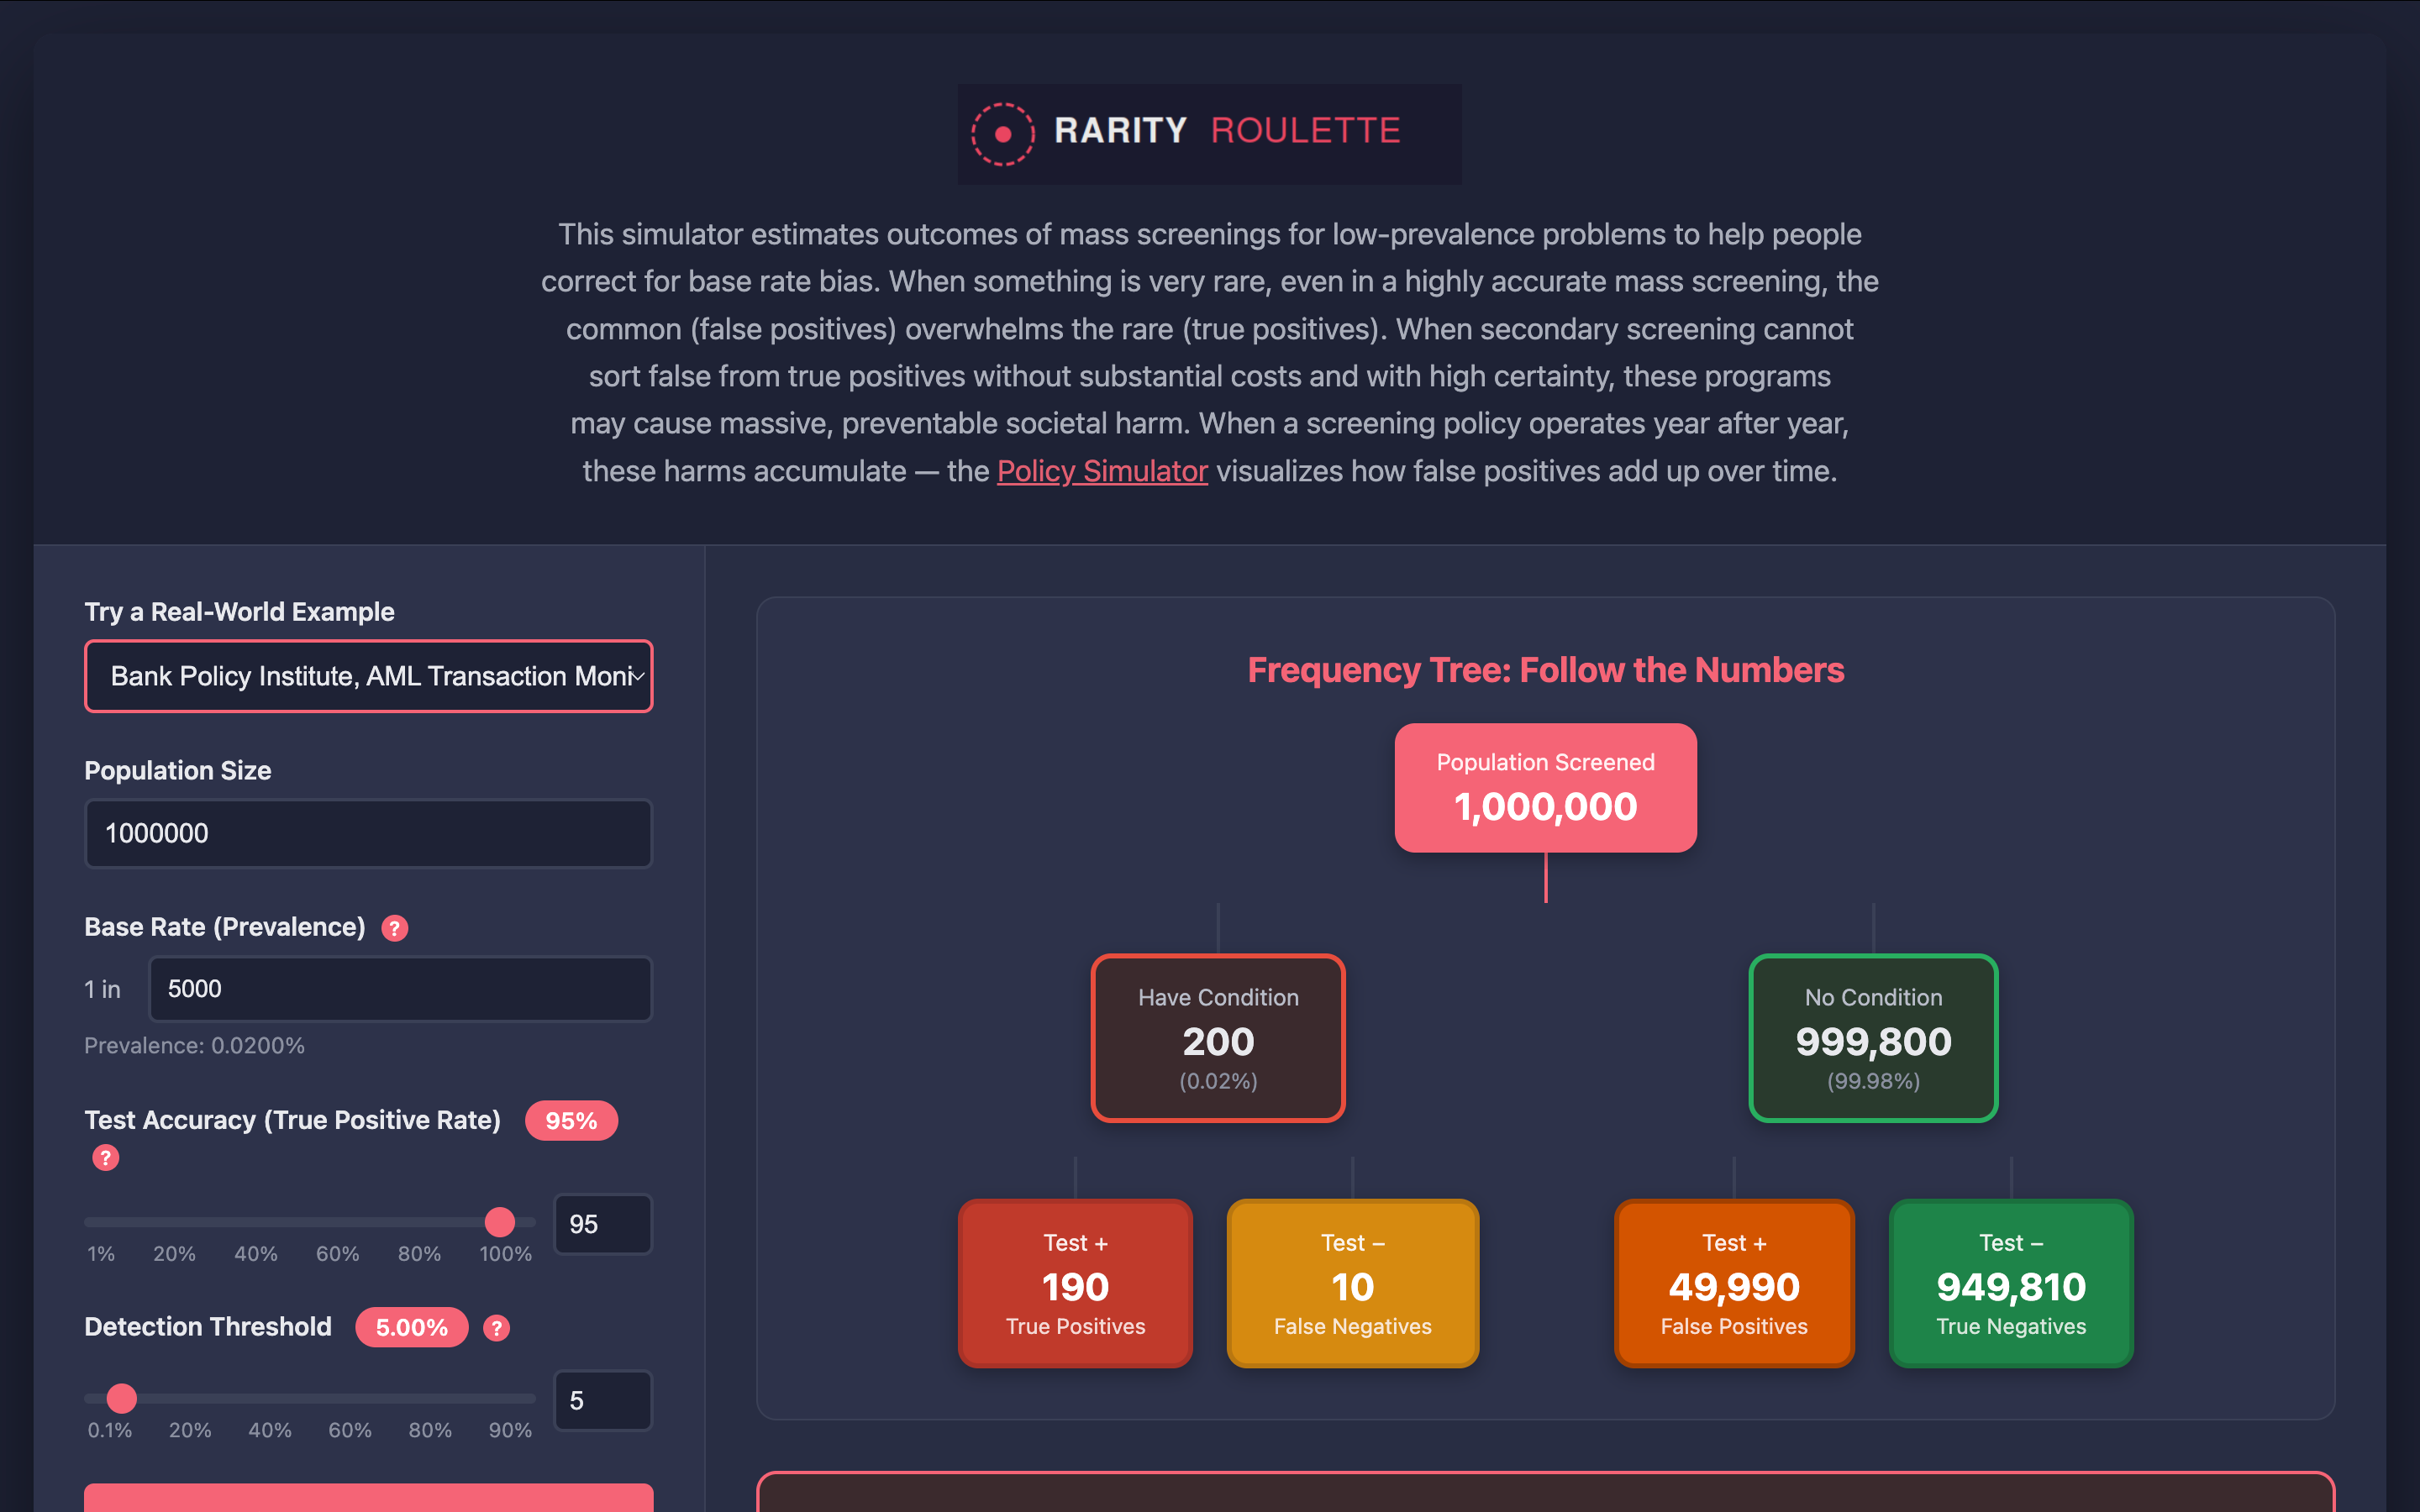
Slide the base rate and the accuracy dials wherever you like; watch the positive predictive value refuse to climb. That stubbornness is the point.
No threshold rescues you: tighten it and you miss the wolf, loosen it and you bury the analyst. This is the same basic arithmetic that produces the catastrophic results in my security working paper, just with euros instead of messages.
So before anyone says “fair,” note that the headline accuracy figure is already a misleading aggregate. And it gets worse, because “accuracy” itself is a compression of at least four different things.
This is the move in Paul Rubenstein, Bernhard Schölkopf and colleagues’ work on when you can validly aggregate a causal model, and which I applied to screening in Scaffolding. Total cholesterol is to LDL-plus-HDL as “accuracy” is to the four pathways below: a sum that can point the opposite direction from its parts. My framework calls them:
Classification — how well does the test classify positive and negative? Sensitivity, specificity, PPV. Where most scientific criticism of screening lives.
Strategy — how the screened population and the institution change behavior because the screen exists. Deterrence, evasion, gaming, risk compensation.
Information — what you learn beyond the label itself. Elicitation, confessions, selection effects, the bogus pipeline.
Resource reallocation — aka opportunity cost. What investigation or prevention didn’t happen because effort went to chasing 50,000 false alarms.
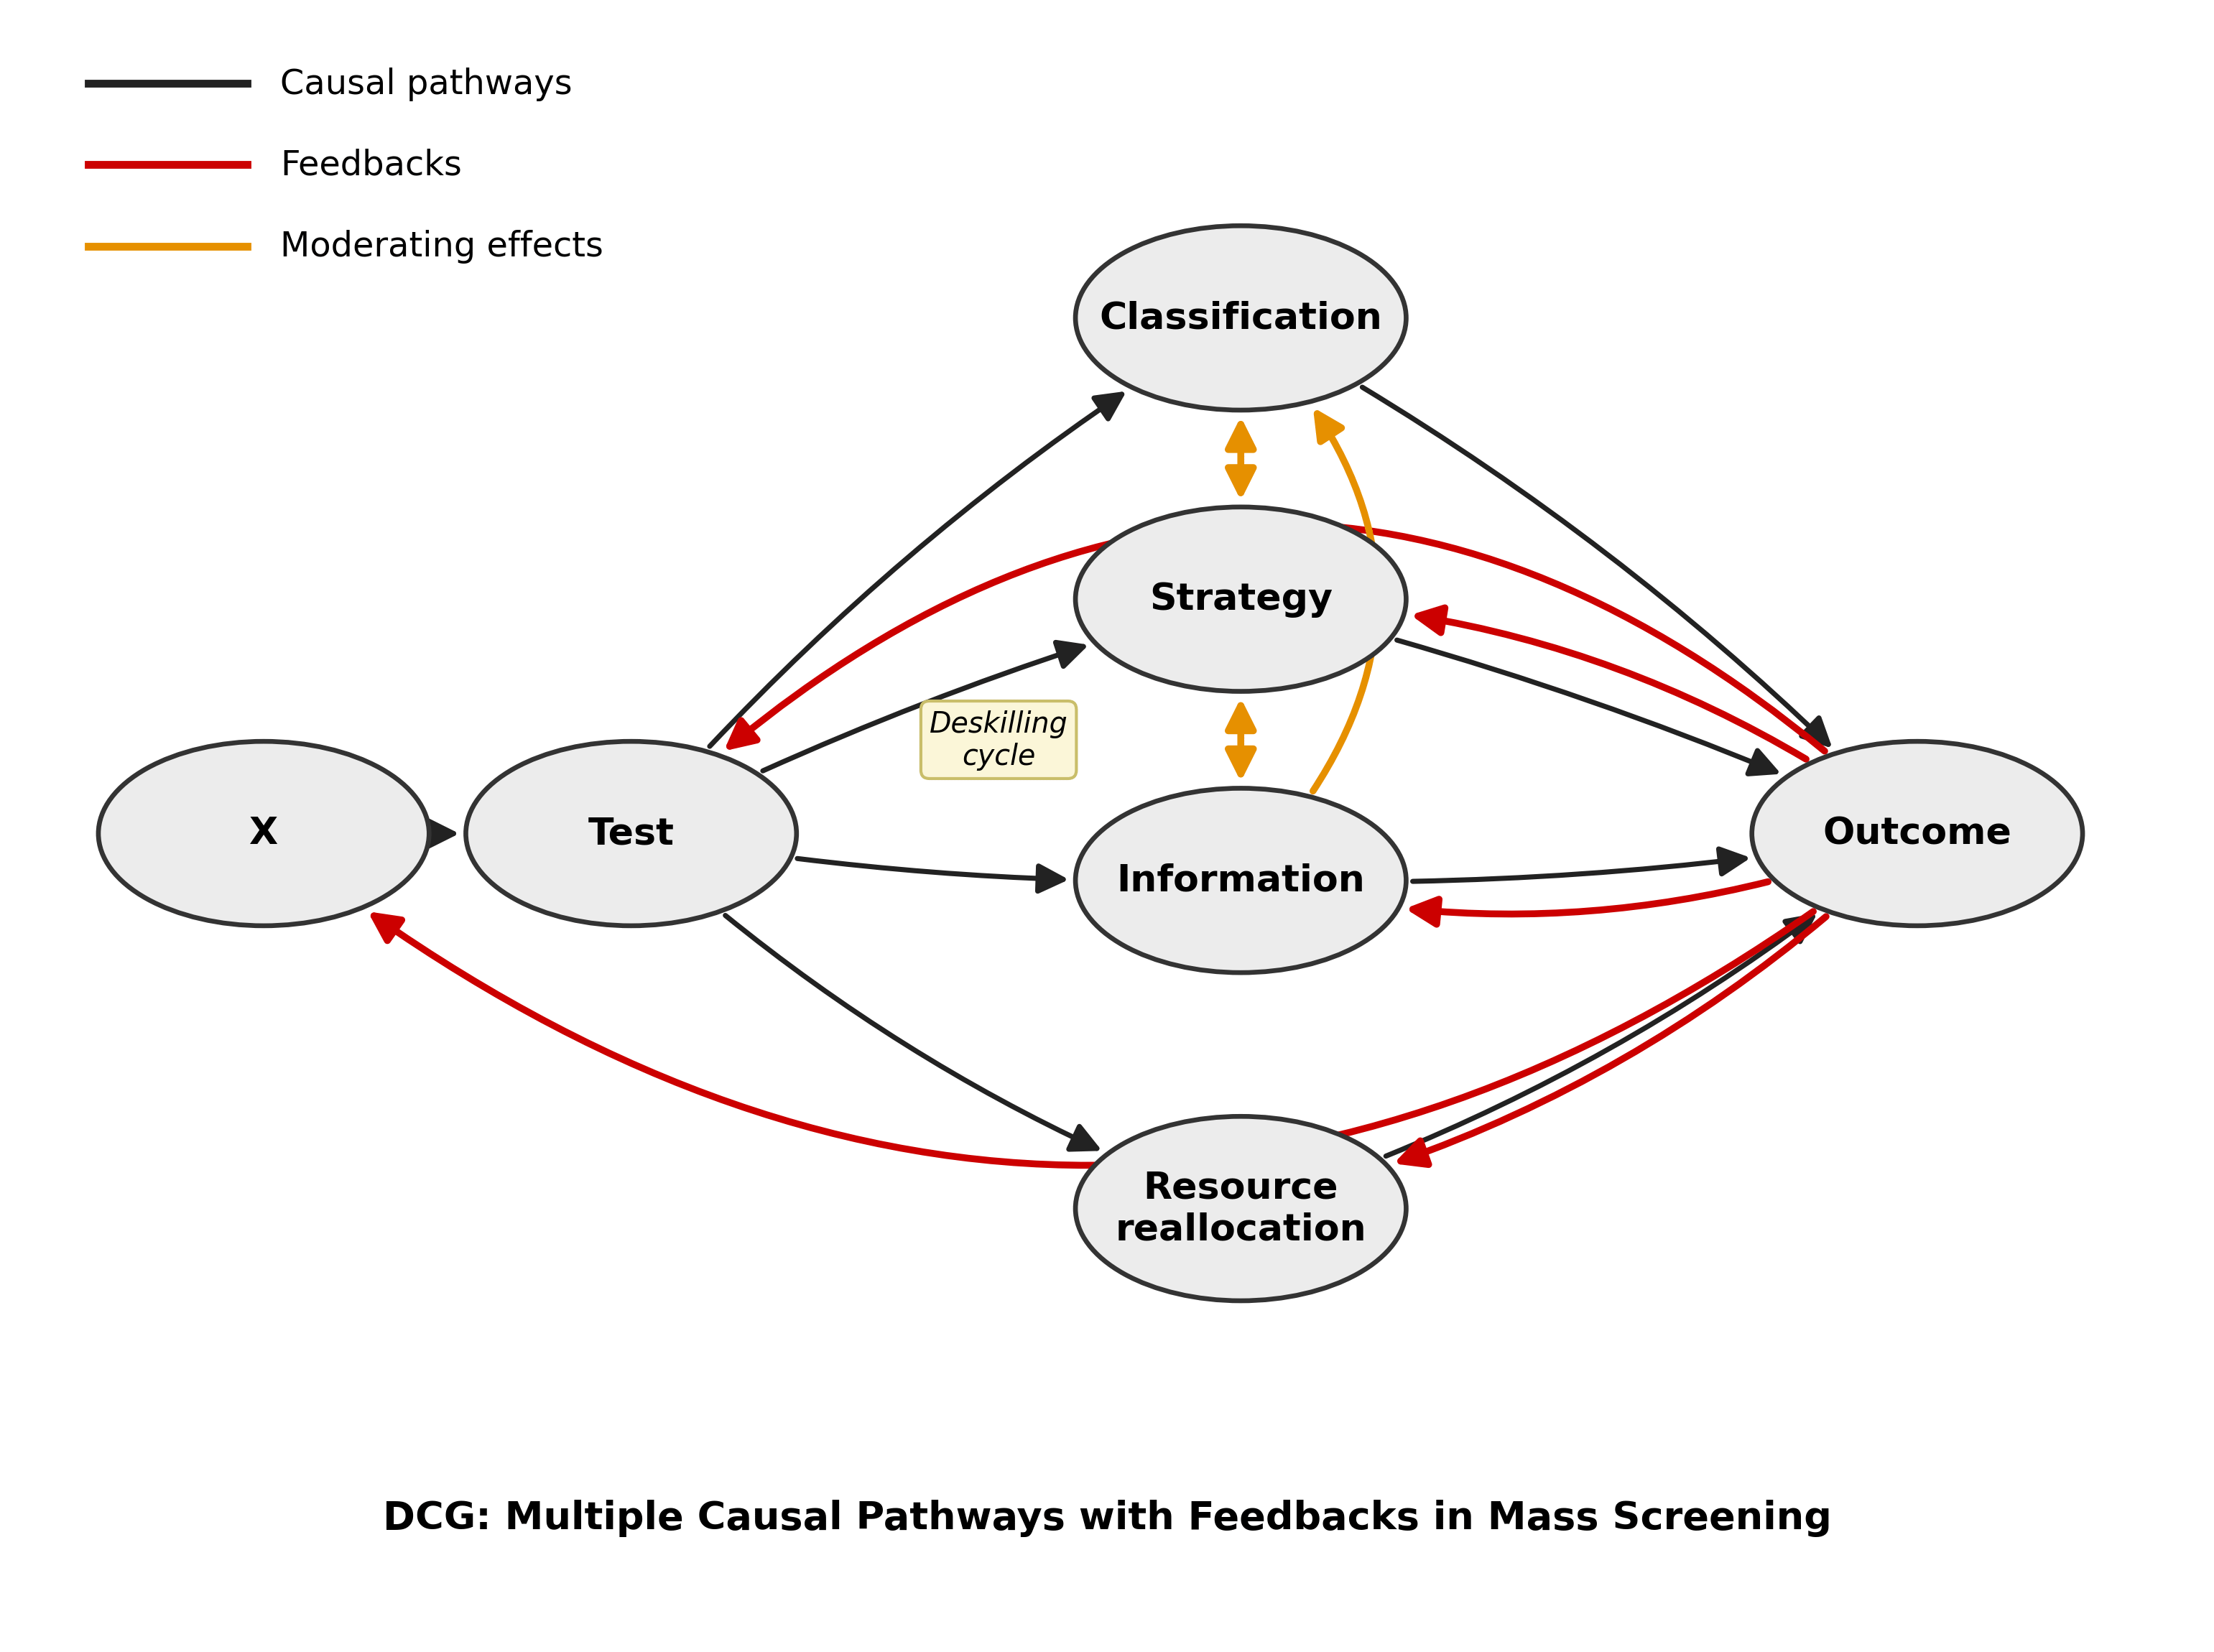
“Is it accurate?” asks only about pathway one. The other three are where the system-level outcome actually gets decided — and they can swamp the first.
Catch Me If You Can
Pathways two and three are where the firm’s classifier stops being a camera and becomes a player in a game.
Fraud and cyber-intrusion detection are adversarial. The screened population isn’t a fixed distribution you sample from; it’s a strategic counterparty that adapts. Figuring out what the model keys on, some of the more dedicated fraudsters reroute, structure, mule, and mimic; a subset of the worst attackers moves to (or makes) a platform that doesn’t get scanned. This is the wolf that learned which pasture you're watching and moved to the next valley — “dedicated attackers evade,” in the game-theory parlance.
The population distribution shifts in response to the screen — which is the textbook definition of performativity, and the reason our beautifully validated model rots in production and gets quietly “retrained” every quarter. (See my reading notes on this whole literature — Perdomo, Hardt, Mendler-Dünner on performative prediction; the older strategic-classification line — in All the World’s a Performative Prediction.)
The deep takeaway for managers is John Miller, Smitha Milli and Moritz Hardt’s: strategic classification is causal modeling in disguise. When people adapt to a firm’s classifier, some are gaming (changing the features without changing the underlying quality) and some are improving (actually becoming what we wanted). You can improve your credit score by moving to a richer ZIP code, or by actually paying your bills. From the outside, both look like “the score went up.” Distinguishing them provably requires solving a causal inference problem. We can’t read it off the accuracy metric, because the accuracy metric is what the gamer games (optimizes against).
This is the strategy pathway. And a vendor’s ROC curve can’t see it.
The Dog That Didn’t Bark
Pathway three has a quieter failure mode, and it’s the more unsettling one: our data are generated by our own decisions.
Let’s say you’re a firm running fraud/AML/housing application programs. You decline the suspicious transaction, freeze the account, reject the applicant — and then you never find out whether you were right, because you blocked the very outcome that would have told you. You only observe labels for the cases you let through.
This is the selective-labels problem, and Kilbertus and colleagues’ Fair Decisions Despite Imperfect Predictions (AISTATS 2020) is the sharpest statement of it: a deterministic policy that learns only from the outcomes it permits can get stuck — never converging on the better policy, because it has blinded itself to the counterfactual. The dog that didn’t bark is the fraud you prevented and the legitimate customer you wrongly turned away, for neither of whom a lab test three days later returns results proving that you got the call right or wrong (unless you are Ribers & Ullrich 2024 with a beautiful case study visualizing the entire ROC space).
So the classifier doesn’t just screen the population. It manufactures its own training distribution, and then trains on it as if it were the world. Our information pathway and resource pathways are entangled here: the labels are selectively generated, and the analysts re-labeling the false positives are the same finite people you needed for the cases that mattered.
The Long Game
Where’s the field going? Toward the cyclic graphing type of case the firm presents: not a one-shot prediction, but a system making decisions over time, on a population that drifts and reacts. The newest entry here is Lee, Padh, Watson, Kilbertus & Singh’s Fairness under Uncertainty in Sequential Decisions (FAccT 2026), which treats fairness as a sequential, reinforcement-learning problem where exploration has to keep pace with data drift and selective-label bias across the whole pipeline — rather than as a constraint we bolt onto a single classifier and drop it. That’s the classifier-in-production case, finally modeled as what it is.
The caveat, because I am constitutionally incapable of ending on confidence: causal-fairness guarantees are fragile. They rely on getting the graph right, and Kilbertus, Ball, Kusner, Weller and Silva showed years ago how sensitive counterfactual-fairness claims are to unmeasured confounding. So this is a scaffold, not a solution. (It’s almost always a scaffold, not a solution.)
Four Questions to Ask Your Classifier
So drop “is it accurate?” and “is it fair?” and ask the four pathway questions instead. They’re the ones that actually predict whether a system net helps or harms:
Classification. At our base rate — not the vendor’s test set — what’s the PPV, and can we operationally survive the false-positive volume it implies? (Not “what’s the AUC?”)
Strategy. Who adapts to this screen, and does their adaptation defeat the signal? Are we measuring gaming versus improvement, or just watching the metric we’re being gamed on?
Information. Are our labels selectively generated by our own past decisions — and are we learning anything from the screen beyond the label?
Resource. What investigation or prevention did this classifier crowd out? What’s the wolf we missed because we were reading 50,000 innocent flags?
A firm that can answer these has a causal model of its screening system. A firm that only knows its accuracy has a number, a dashboard, and a false sense of security — which, as it happens, is the through-line of everything I study.
One last, understated note for anyone sitting on the data: firm-level classifier logs are an almost completely untapped testbed for these questions. The security domains I usually work in can’t randomize and have no ground truth. A firm running A/B’d thresholds on a fraud queue has both. That’s not a footnote; that’s a research program waiting for someone with access.
So where do we get the access?
Show Me the Data
Naming the four pathways is easy. Decomposing them — estimating each one’s contribution separately — requires pathway-specific data. And there, the domain is decisive.
In security, the obstacle is non-transparency. You can’t watch the strategy or information pathways because the program won’t show its workings, so you take the best available estimates and transport.
My polygraph simulation ran on parameters ported from wherever they happened to be measured — lab bogus-pipeline and street-crime deterrence meta-analyses, dropped into a screening context they were never measured in — because the agency data I wanted died in years of mostly unsuccessful FOIA fights. The one empirical foothold, publicly available LEMAS (nationally representative U.S. police agency) data, handed me an outcome (use-of-force complaints) but couldn’t decompose the pathways behind it.
Chat Control and iBorderCtrl were worse: the programs’ own performance data stayed sealed — iBorderCtrl’s pilot evidence stayed secret Patrick Breyer’s best FOI litigation efforts, and Chat Control’s base rates rest on unverified industry figures — so those numbers lean on published proxies and the same transported deterrence estimates.
The one time cold outreach paid off, it was a domain expert, not a program, who answered: the resource-pathway capacity numbers came from a practitioner interview.
In medicine, by contrast, the main obstacle is decomposition. You can get outcomes — who was recalled, who was diagnosed, who died — from some fabulous Scandinavian and Asian cancer registries, for instance. But this won’t yield the data that separates classification from strategy from information. The endpoint is visible; the mechanism isn’t.
In firms, by contrast, the obstacle is negotiable. A willing partner can let you manipulate the pathways instead of inferring them: change the incentive structure and watch the strategy pathway move, change the invitation and watch the information pathway move. That’s the sort of randomized experiment to which the other two domains are relatively hostile.
But — and this is the case-selection catch I keep circling — the information pathway only opens if the screened person wants to engage with the invitation. Which rules out exactly the adversarial classifiers I opened with: a bank’s fraud screen is great for studying evasion (strategy) and useless for studying elicitation (next-to-nobody volunteers a confession to their bank). The sweet spot is a firm whose screened population is motivated to participate — a hospital or a health insurer, where the patient who doesn’t want cancer shows up, discloses, and engages. There, and maybe only there, can you run the experiments that decompose all four. So the case study I most want isn’t the fraud queue. It’s the clinic with a claims department.
Same Meat, Different Sauce
So here’s the same argument I make about polygraphs and Chat Control, about mammography and PSA testing, now wearing a blazer: model-level accuracy does not translate into system-level benefit, and the gap between them is causal. Sensitivity and specificity are properties of a test. Whether a screening program helps is a property of a system — with strategic actors, feedback loops, manufactured data, and finite analysts. Aggregate across those and you get a number that can point the opposite way from the thing you care about, like a diet that lowers your total cholesterol and raises your risk of a heart attack.
The screen is not a camera. It’s an engine (Mendler-Dünner). And the wolf knows the sound.
References
Bank Policy Institute (2020). “The Truth About Suspicious Activity Reports.” Bank Policy Institute, 9 November 2020.
Brian Hedden (2021). “On Statistical Criteria of Algorithmic Fairness.” Philosophy & Public Affairs, 49(2), 209–231.
Niki Kilbertus, Mateo Rojas-Carulla, Giambattista Parascandolo, Moritz Hardt, Dominik Janzing & Bernhard Schölkopf (2017). “Avoiding Discrimination Through Causal Reasoning.” NeurIPS 30, 656–666. (arXiv:1706.02744)
Niki Kilbertus, Manuel Gomez-Rodriguez, Bernhard Schölkopf, Krikamol Muandet & Isabel Valera (2020). “Fair Decisions Despite Imperfect Predictions.” AISTATS, PMLR 108. (arXiv:1902.02979)
Niki Kilbertus, Philip J. Ball, Matt J. Kusner, Adrian Weller & Ricardo Silva (2019). “The Sensitivity of Counterfactual Fairness to Unmeasured Confounding.” UAI.
Karel Lannoo & Richard Parlour (2021). Anti-Money Laundering in the EU: Time to Get Serious. CEPS-ECRI Task Force Report, 28 January 2021. Centre for European Policy Studies, Brussels.
Michelle Seng Ah Lee, Kirtan Padh, David Watson, Niki Kilbertus & Jat Singh (2026). “Fairness under Uncertainty in Sequential Decisions.” FAccT ‘26.
Celestine Mendler-Dünner, Gabriele Carovano & Moritz Hardt (2024). “An Engine Not a Camera: Measuring Performative Power of Online Search.” Advances in Neural Information Processing Systems 37 (NeurIPS).
John Miller, Smitha Milli & Moritz Hardt (2020). “Strategic Classification Is Causal Modeling in Disguise.” ICML, 6917–6926.
Juan Perdomo, Tijana Zrnic, Celestine Mendler-Dünner & Moritz Hardt (2020). “Performative Prediction.” ICML, 7599–7609.
Drago Plečko & Elias Bareinboim (2024). Causal Fairness Analysis: A Causal Toolkit for Fair Machine Learning. Foundations and Trends in Machine Learning: Vol. 17, No. 3, p. 1–238.
Michael Allan Ribers & Hannes Ullrich (2024). “Complementarities between algorithmic and human decision-making: The case of antibiotic prescribing.” Quantitative Marketing and Economics, 22(4), 445–483.
Paul K. Rubenstein, Sebastian Weichwald, Stephan Bongers, Joris M. Mooij, Dominik Janzing, Moritz Grosse-Wentrup & Bernhard Schölkopf (2017). “Causal Consistency of Structural Equation Models.” UAI.