
Multiverse Policy Analysis, Pha
Limits are pervasive, keeping it simple is smart, and the causal graph for mass screenings for low-prevalence problems extends to science on such screenings

We’ve been doing cost-benefits analysis wrong, over-simplifying and not attending enough to practical considerations. But doing it better will still require plenty of simplification and not be able to escape the effects of, well, practical considerations. Scientists should be transparent about that, and try to aspire to accuracy and neutrality, anyway.
The Class Break
When we left off rethinking how net effects seem to have previously been assessed for mass screenings for low-prevalence problems, I added the resource (re)allocation logic to the causal diagrams. Drawing causal diagrams for programs of this structure applies insights from the causal revolution to render all previous cost-benefits analyses of such programs — including Stephen Fienberg’s 2003 NAS polygraph report — methodologically obsolete.
In hacker parlance, this is a class break — the identification of a vulnerability that affects an entire class of machines, operating systems, or, in this case, program efficacy analyses.

What science missed
In scientific terms, it demands we contextualize typical warnings about the base rate bias, along with other concerns about test accuracy and error, as part of a bigger picture in which we need to think about systematically estimating net effects. In that, it offers a logical explanation in the language of contemporary methods for why it often seems that, in evaluating mass screenings for low-prevalence problems, statisticians and practitioners are at odds.

Statisticians tend to say these programs risk backfiring, undermining the very security, health, or other endpoint or value they’re intended to promote. Practitioners tend to say they save lives. Accounting for multiple possible causal mechanisms of these programs could explain the discrepancy: Where statisticians correctly warn of base rate bias, practitioners may also correctly estimate net security, health, or other endpoint gains in spite of net losses due to the accuracy-error trade-off along the test mechanism alone.
Framing debate
What does correcting this mistake mean to scientists? There are two main competing strains we could plug into here.
This correction may align with Gigerenzer’s story that, sure, cognitive bias is a pervasive human problem. But animals exhibit intelligence in their behavior all the time, humans are animals too, and some evidence suggests we’re not functionally that dumb. Rather, it’s (biased, self-interested) scientists who have perverse incentives to see things that way.
Accordingly, a competing explanation aligns with Gigerenzer’s usual opponents, Kahneman, Tversky, Welch et al, Greenland, etc. This alternate story says something like: bias and error that we can frame politely in terms of pervasive cognitive distortions — and more crudely in terms of perverse incentives to serve powerful sociopolitical network interests — color all areas of human endeavor. Science, of course, is no exception. So both statisticians and practitioners are likely to be at least partly wrong, probably in ways that we can’t even fully identify, because we’re only human, too. One little turn of the wheel forward towards better science doesn’t change that. There is no exiting the sociopolitical swamp or our human fallibility.
Polygraph case study exceptionality
It is ironic that, as a longtime polygraph critic, I feel compelled to note that the possibility of net security gains from multiple causal mechanisms looks particularly compelling in the lie detection case. This is an argument that other polygraph critics whose work I respect and admire (Lykken, Iacono, Alder, Fienberg) seem to have missed. One reason (to not make myself too beloved by polygraphers) is that the polygraph is the ideal-type bogus pipeline (fake lie detector). So it elicits information in a way it’s not obvious other screenings do, though it’s certainly plausible that analogous elicitation effects exist in other encounters, from cancer screenings (“doc, I also have fatigue”) to employment screenings (“there was a problem on your background investigation; is there anything you’d like to explain?”) or security programs (“We’ve been monitoring your Internet activity; do you want to come clean?”).
Does it matter?
In practice, “class break” sounds impressive, and scientists love telling one another they’re wrong.

But it remains to be seen whether and how much this whole pictorial abstraction really changes net effects analyses across different mass screening programs in diverse domains… Assuming that we care, because such analyses have some real-world consequences sometimes — as Fienberg’s flawed NAS analysis did.
Recap: four mechanisms, not one
Again, the big picture looks something like this:
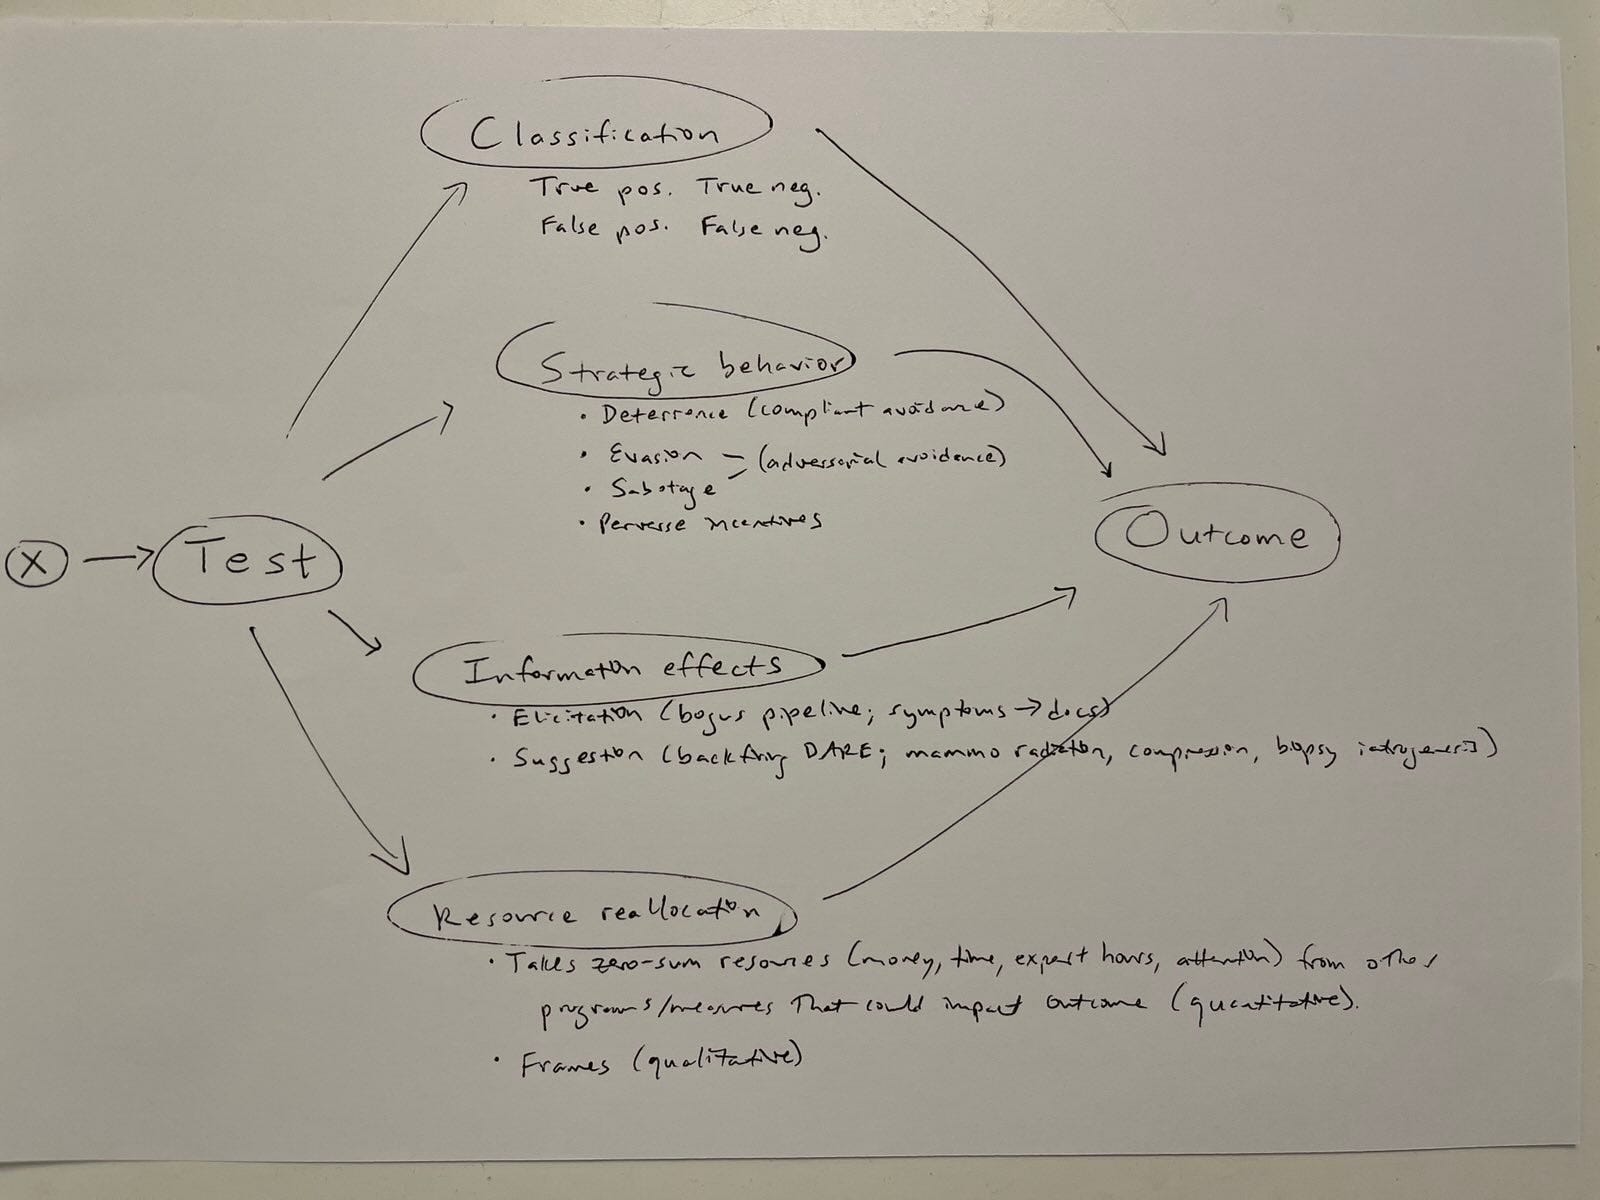
… where some selection component leads to the test, which has four causal mechanisms: (1) classification into true and false positive and negative results, (2) strategy featuring deterrence as a phenomenon of compliant avoidance, evasion and sabotage as different forms of adversarial avoidance, and perverse incentives — about which I subsequently thought/drew more about in medical and security contexts, (3) information effects including elicitation as in the bogus pipeline in security/research contexts and people volunteering symptoms to docs in medicine, as well as suggestion where the program gives people (or tissue) ideas which may have intended consequences, and (4) resource (re)allocation, which has quantitative (zero-sum) and qualitative (framing) components.
Again, we might expect elicitation to matter more in security contexts (great if dumb criminals confess when you put a colander on their heads, to paraphrase Mark Zaid) and less in wealthy, Western medical ones (e.g., people volunteering irrelevant symptoms during cancer screening conversations that lead doctors to give them yet more diagnosis and treatment — when overdiagnosis and overtreatment pose real risks to net health outcomes in this context). On one hand, someone should probably do some systematic review and meta-analytical work to try to figure out how the different mechanisms matter across different issue areas. On the other hand, I doubt there’s adequate available evidence to meaningfully do that.
Feedbacks and moderating effects
Anyway, “all models are wrong,” and the above representation is wrong in pretending the graph is one-way for heuristic purposes in a DAG (directed acyclic graph). But, in reality, feedbacks and moderating effects complicate the picture like this:
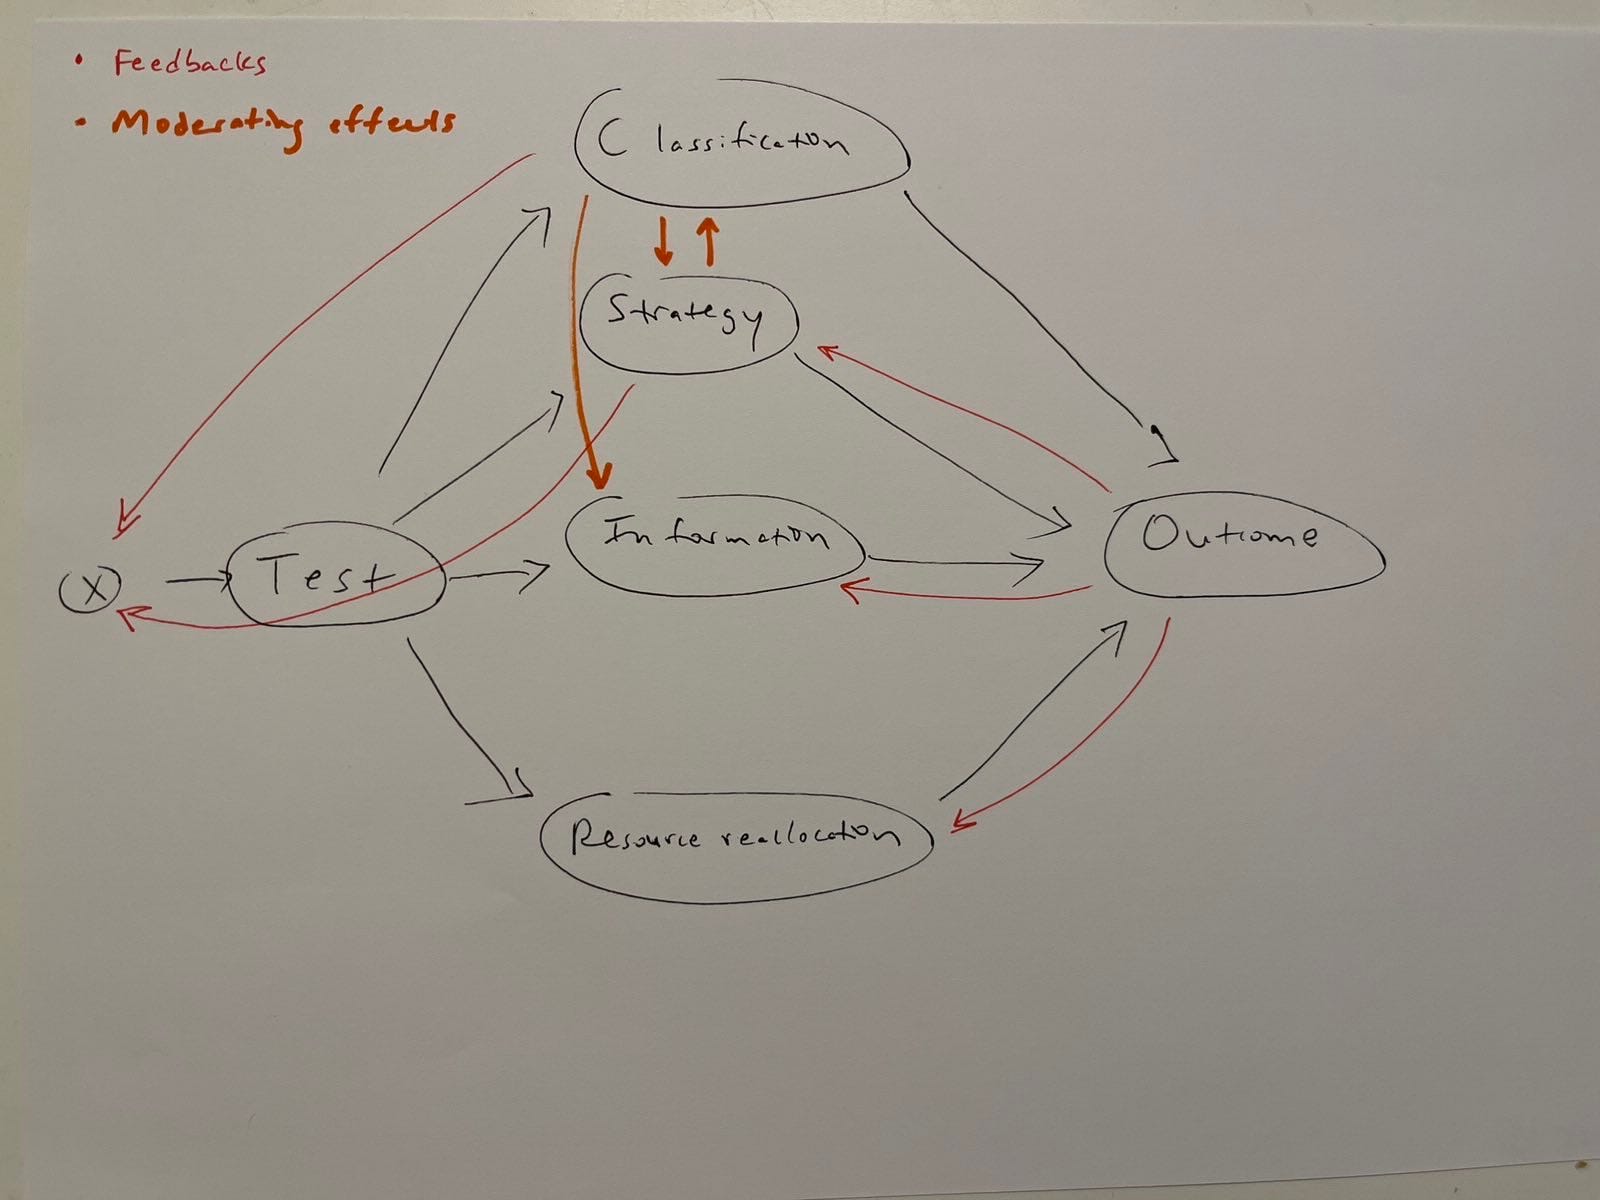
… in a DCG (directed cyclic graph) showing feedbacks in red. (This one also shows moderating effects in orange. This is technically wrong; causal graphs don’t do moderating effects. But we do want to remember that they exist. So this is an especially wrong but useful model.)
Why resources matter
This is, of course, not new logic. Least of all the resource (re)allocation logic I drew last. To the contrary, resource constraint concerns have been at the heart of discussions about the possible net harms of programs like Chat Control and its mass security screening ilk for some time.
This is probably also the best argument against mammography and most other cancer screenings at a societal level: These exceptionally well-studied programs with unambiguous end-points (i.e., look at countries with different screening programs; count the bodies) don’t demonstrably save lives by decreasing all-cause or all-cancer mortality. In the meanwhile, they cost a lot of money that we could be using to research how to prevent breast cancer instead. That’s in addition to concerns about overdiagnosis harms, which include common reports of persistent pain from unnecessary surgeries, and possible spreading of cancer cells from compression, needle biopsy, or surgery.
These concerns have important sociopolitical implications. Yet, we don’t usually see the resource (re)allocation logic represented in cost-benefits analyses on mass screenings for low-prevalence problems. Why?
The methodological answer is: because the causal diagramming has been missing from these analyses, because it’s a relatively recent advance that helps us systematically integrate qualitative information to think through causality logically before running statistical analyses. When you diagram out causal mechanisms, you see where to plug in the different lines of causal logic people discuss. The logics aren’t new, but thinking about them visually like this is (relatively speaking).
(When I was in grad school, it was thought to be very weird that I first interviewed a bunch of people and then designed and ran a bunch of studies. Qualitative and quantitative methods were considered different methods specialties, and their practitioners different tribes, opposed in the internecine conflict of acquiring funding, students, and other status symbols. Accordingly, the IRB did not know what to do with much of my research, because it was so unusual that one researcher would use so many different methods. But you have to do this, to do good science.)
The practical answer is: people don’t factor in resource limitation, because people also have limited resources. “Isn’t it ironic?”

But would it really be that hard?
Much uncertainty
One of the problems with integrating resource (re)allocation in net effect analyses of mass screening programs is that these implications are highly uncertain. That doesn’t mean we shouldn’t do them. It means we shouldn’t expect to know for certain which way the estimated effect swings.
Take, for instance, the breast cancer case: novel experimental research on lowering mothers’ folate status and/or biweekly ibuprofen supplementation might yield new information about preventing highly lethal but rare postpartum breast cancers. It wouldn’t take a huge, proven preventive benefit to save lives, especially relative to mammography (which, again, has no such proven net benefit). But postpartum breast cancer has such a low prevalence — affecting around 2 in 10,000 moms annually (or .02%) — that it would probably take a very large sample to definitively estimate the effect.
Specifically, if the treatment halved postpartum breast cancer incidence, reducing it to .01% of moms annually, we would need a sample size of about half a million moms (470,860, according to this calculator) in order to have an 80% chance of detecting a statistically significant treatment effect. We might want to think hard about whether a smaller effect is practically important. Working backwards from saving one in a million lives might make sense as an heuristic, since the obvious treatment (ibuprofen and lifestyle counseling) is very affordable and society has an interest in children growing up with living mothers (if we must put this in heartless terms). But we don’t know that we would save any lives at all; otherwise, we wouldn’t need to do the research.
Scientific progress in this area, as in most areas, is hindered by perverse incentives. Researchers whose grant funding depends on postpartum breast cancer’s importance have consistently over-estimated its prevalence by an order of magnitude. (Strangely, when I corrected them, no one thanked me and cited the lower incidence in their next grant proposal.)
And it’s not politically possible to take some of mammography’s millions in public funding, and reallocate them to preventive research. To the contrary, political backlash has previously kept the programs well-supported in spite of evidence that they may not work and harm large numbers of women through overdiagnosis.
So we want to encode uncertainty in the model. A lot of it. We want to encode it along all four causal mechanisms, and this looks like the most uncertain pathway. There is just not a huge psychological or sociopolitical payoff to be had from doing this work. I still think it should be done, because important things should be done right. But is that really the right goal?
Multiverse policy analysis, pha
Previously, I wrote that making uncertainty more explicit in estimating program costs and benefits might mean reappropriating Steegen et al’s multiverse analysis. But that “Surely there is already a name for this and a literature doing it.”
Indeed there is. What I called “multiverse policy analysis” (and what Steegen et al called multiverse analysis) could just be Bayesian analysis in which personal uncertainty gets encoded in the model. To wit:
It is often said (incorrectly) that ‘parameters are treated as fixed by the frequentist but as random by the Bayesian.’ For frequentists and Bayesians alike, the value of a parameter may have been fixed from the start, or it may have been generated from a physically random mechanism. In either case, both suppose that it has taken on some fixed value that we would like to know. The Bayesian uses probability models to express personal uncertainty about that value. In other words, the ‘randomness’ in these models represents personal uncertainty; it is not a property of the parameter, although it should accurately reflect properties of the mechanisms that produced the parameter (p. 331 of Sander Greenland, “Chapter 18: Introduction to Bayesian Statistics.” In Rothman KJ, Greenland S, and Lash TL (eds). 2008. Modern epidemiology, 3rd edn. Lippincott-Williams-Wilkins, Philadelphia, p. 328–344; h/t SG).
So, how many lives could the missing research literature on preventing postpartum breast cancer along the given causal pathways (exercise, diet, serum folate reduction, anti-inflammatory consumption, and poison abstention) conceivably save? We want to know this fixed number, but we don’t know enough to know. We can, however, encode our uncertainty about properties of mechanisms that produce the hypothetical effect we want to estimate.
But this sounds too fancy to actually do?
One of the beautiful things about this is that it (too) isn’t as specialized or complicated as it sounds. Rather, it looks very much like an old standard statistical methods tool, sensitivity analysis:
Connections to sensitivity analysis
There is a close and complementary connection between Bayesian methods and sensitivity analyses, in which parameters fixed at defaults by frequentist methods are varied to see their impact on statistics. Simple sensitivity analyses will reveal unlimited sensitivities to certain variations and, hence, convey no information unless coupled with contextual information to determine what variations are meaningful. That is none other than prior information, which can be formalized in a prior distribution for use in Bayesian or analogous prior-sampling methods for risk and decision analysis. In this format, one can also conduct Bayesian sensitivity analysis by seeing how results vary as the prior is varied; in this process, data representations can help one judge the priors that are credible enough to examine (p. 774, Sander Greenland, “Bayesian perspectives for epidemiological research: I. Foundations and basic methods,” Int J Epidemiol, June 2006;35(3):765-75).
In other words, one way of doing “multiverse policy analysis” would be to do Bayesian sensitivity analysis in order to inform which priors to examine in further analyses.
On one hand, this makes me look silly for blogging about “multiverse policy analysis.” On the other hand, this makes other people look silly, too, for publishing about multiverse analysis. (Though at least they got some sort of credit for their mistake!)
Again, the good news here is that bringing Bayesian methods to these sorts of analyses doesn’t have to be very computationally complex. This conflicts with “the misimpression that practical Bayesian analyses are inherently more complex computationally than frequentist analyses. But this impression is based on an unfair comparison of exact Bayesian methods to approximate frequentist methods” (p. 333, Greenland, Chapter 18: Introduction to Bayesian Statistics”).
Everyone is doing Markov-chain Monte Carlo at least since David Spiegelhalter and colleagues made it easy with WinBUGS. But that is really computationally intensive and not necessary for doing Bayesian analyses. In fact, “basic [Bayesian] analyses can be conducted with a hand calculator or ordinary software packages” (p. 765, Greenland, “Bayesian perspectives…”). Moreover, “MCMC refinements may only add a false sense of precision to inaccurate results” (p. 342, Greenland, Chapter 18: Introduction…).
Sounds familiar? Satisficing, type-II rationality, and science within limits
Remember that time you quickly made the best decision you could with limited information and it turned out fine?

Either you just got lucky, or you were following the wisdom of Herbert Simon, making better decisions satisficing — deciding “good enough” on imperfect information — rather than optimizing, or trying to figure it all out and make the best possible choice.
In the same era, in Good Thinking: The Foundations of Probability and Its Applications, Jack Good proposed a similar idea, Type-II rationality, moored specifically in the context of computational costs. He defines it as “the recommendation to maximize expected utility allowing for the cost of theorizing… [involving] the recognition that judgments can be revised, leading at best to consistency of mature judgments” (p. 20). “It means that in any practical situation you have to decide when to stop thinking” (p. 29). “Another name for the principle of Type II rationality might be the Principle of Non-dogmatism” (p. 30). “It is impossible to reconcile this fully with ordinary logic” (p. 89). That is because Type I or classical rationality demands complete consistency with the axioms of utility and conditional probability, while Type II calls time on evaluating such consistency (p. 123).
As an application of this principle, Good proposes “a Bayes/non-Bayes compromise” which acknowledges “how some apparently objective statistical techniques emerge logically from subjective soil, and can be further improved if their subjective logical origins… are not ignored” (p. 22). “There should be... a constant interplay between the subjective and objective points of view and not a polarization separating them” (p. 23).
Balancing these considerations of accuracy versus computational cost including time, Good argues, “resolves all the important fundamental controversies in statistics, but we shall go on arguing because, being mortal, we are anxious to justify our existence, and for other reasons not mentioned in polite society” (p. 185).
The old graph-cutting problem
In other words, the causal graph for mass screenings for low-prevalence problems might be said to extend to research on these programs. So that it’s not just the accuracy of this research that matters (the so-called test classification mechanism). But also strategic behavior (e.g., scientists accounting for time in calculating their own computational costs; perverse incentives), information effects (e.g., confirmation bias as a sort of suggestion effect), and resource (re)allocation (e.g., scientists spending time on calculating test effects to the exclusion of evaluating the other mechanisms, simply because time is limited).
At a more abstract level, both test/screening and research/science are epistemic interventions. Both (aim and/or claim to) create knowledge or evidence. The unit of analysis in mass screenings is usually individuals within populations, while the unit in science is usually programs. In this relief, it’s obvious that it doesn’t make sense (in a type 1 rationality way) to focus on one program in a vast sea of identically mathematically structured programs, as is usually done. That focus is a product of the unavoidable role of irrational things like biases, perverse incentives, and resource limitations that affect science just as they affect the programs scientists study.
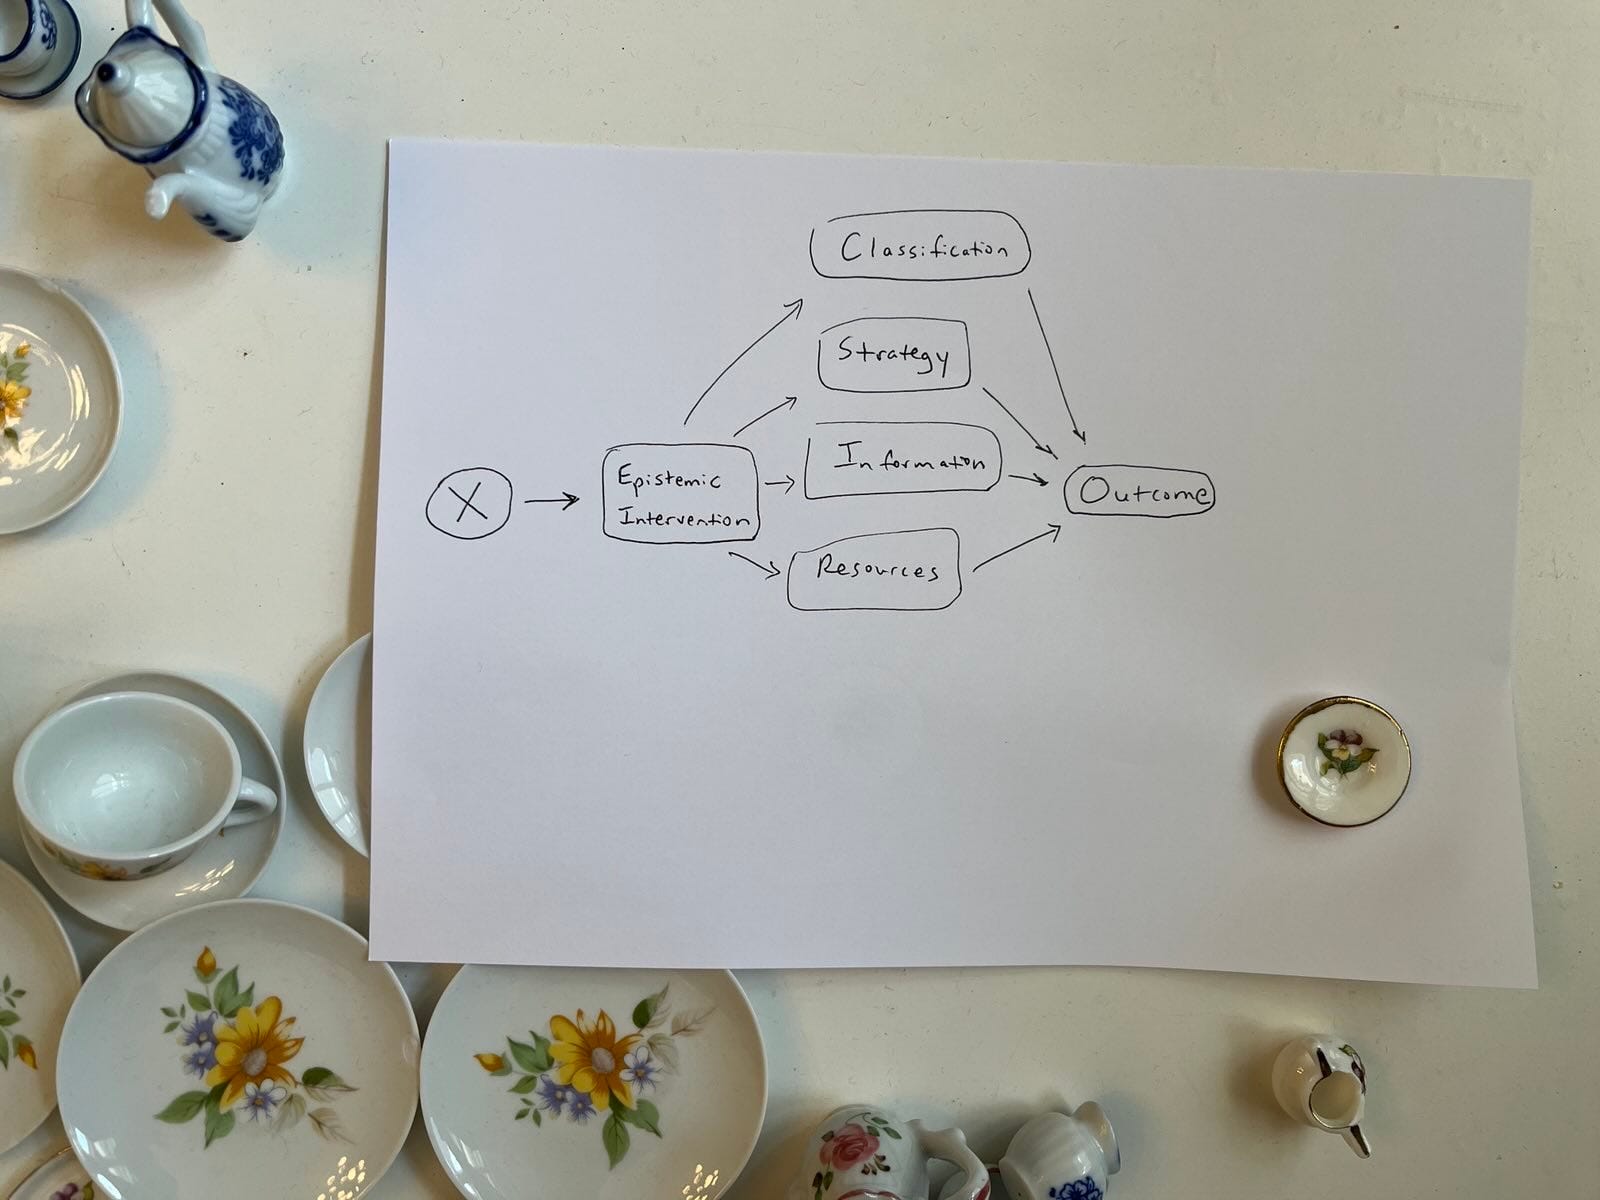
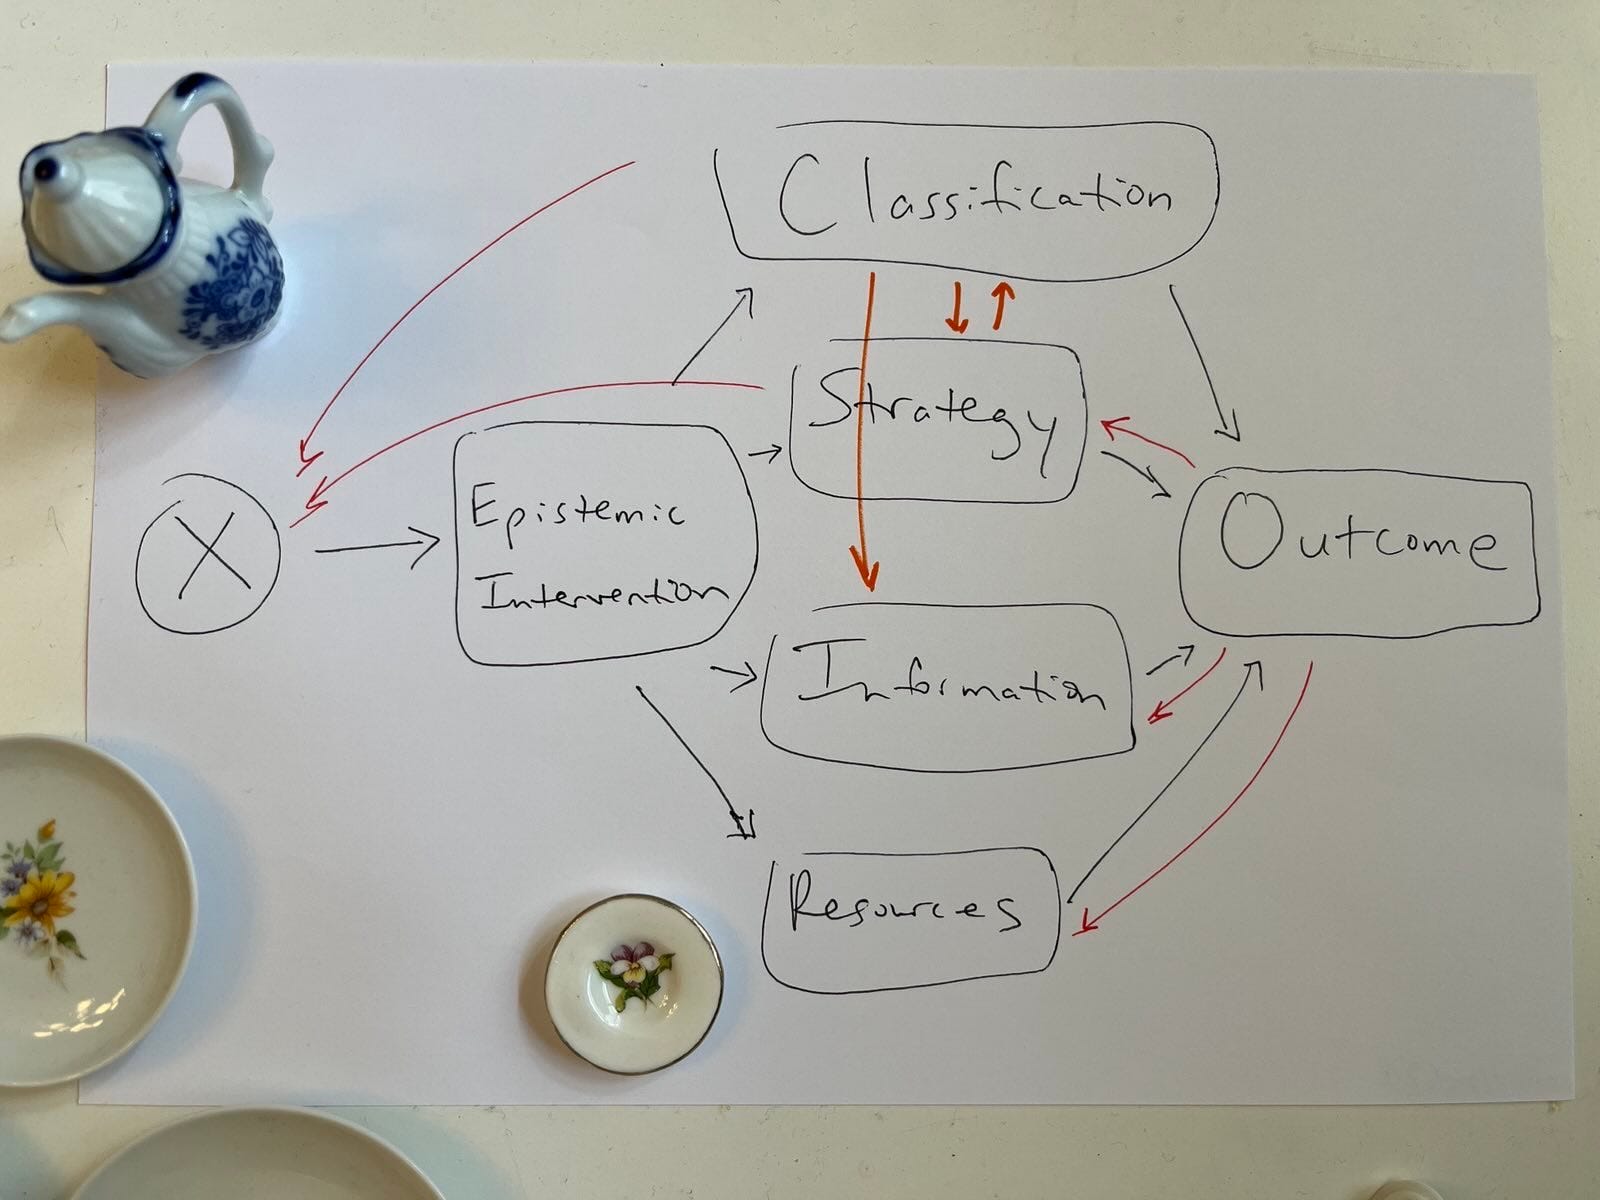
Gentle souls who are not strong enough to withstand my handwriting and other mess may prefer this form of the same graph:

In other words, science itself — like the screenings society increasingly uses to help classify the world — can’t change the messy structure of the policy world it’s trying to help classify. It’s part of a messy real world of feedback loops and limits, inexorably vulnerable to the same distortions classically critiqued in the objects of its study. Scientists are inevitably influenced in our own human perceptions of and ability to correct for these distortions. One consequence of this is that we need to be really careful about making definitive pronouncements that programs do or don’t work, when we know damn well that we often don’t have the evidence to know that.
This is just an extension of the old insight that we have to cut the causal graph somewhere, or, more broadly, decide on what problem to use any given methodological tool. This has implications for a lot of contemporary debates, from free will versus determinism, to liberty versus security, and, here, science versus meta-science. Setting the terms of the discourse, in other words, often means winning the match.
Using the best tools we have
I am, it seems, just slowly winding my way around to using the best available methods and logical insights (some causal revolution here, some Bayes-non-Bayes compromise and satisficing there) to do a few better cost-benefits analyses than are usually done. I’m sure they could be done better still, but (ever willing and able to create manufactured stress through fake deadlines), I capped my research proposal groundwork at this month. So they probably can’t be done better than this by me in the next three years. Because I still have to deal with alternate Bayesian analytical paradigms and equilibrium effects by early May. Otherwise, I will prepare forever instead of making pitches and getting research funding again someday, because women overprepare a scientist’s work is never done.

Addendum
In the latest batch of SG readings with thanks, I came across a few citations that may be formally preferable for “Data alone say nothing at all”:
Sander Greenland, *Chapter 18: Introduction to Bayesian Statistics.* In Rothman KJ, Greenland S, and Lash TL (eds). 2008. *Modern epidemiology*, 3rd edn. Lippincott-Williams-Wilkins, Philadelphia, p. 328–344.
DATA ALONE SAY NOTHING AT ALL
It is sometimes recommended that the prior should be given up if it appears to be in conflict with the ‘actual data’ (e.g., Robins and Greenland, 1986). The conflict, however, is between the prior and the frequentist result from the data model; without a model for the data-generating mechanism, the data alone can conflict with nothing (Robins, 2001) (Greenland, p. 341, Chapter 18: Introduction to Bayesian Statistics).
Sander Greenland, “Bayesian perspectives for epidemiological research: I. Foundations and basic methods,” Int J Epidemiol, June 2006;35(3):765-75).
Data alone say nothing at all
It is sometimes recommended that the prior should be given up if it appears in conflict with the ‘actual data.’ The conflict, however, is between the prior and the frequentist result from the data model; without a model for the data-generating mechanism, the data alone can conflict with nothing (Greenland, p. 773, “Bayesian perspectives…)